
Want to prevent yawns and glazed-over eyes? Before you deliver your next speech, pitch or address, learn how to create exceptional visuals by following these rules (with real before-and-afters).
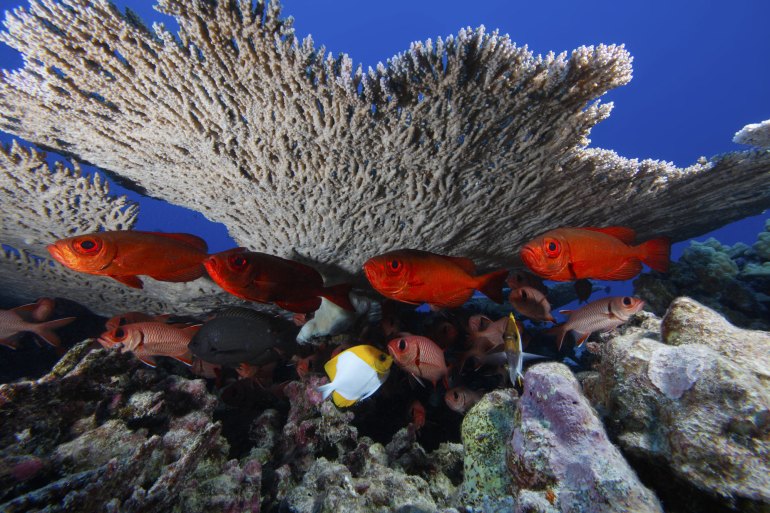
Given climate change, coral bleaching, ocean acidification and overfishing, it can be easy to feel depressed about our oceans. But when you look at the big picture of ocean health, good news emerges.
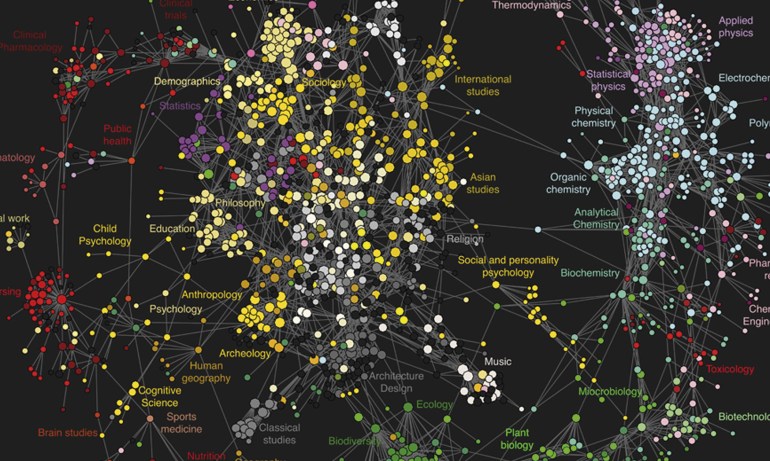
Designer and data visualization expert Manuel Lima has been watching with interest as the network has emerged as a powerful way to visualize many of the things going on in the world around us. Here, he shares some of his favorite graphics.
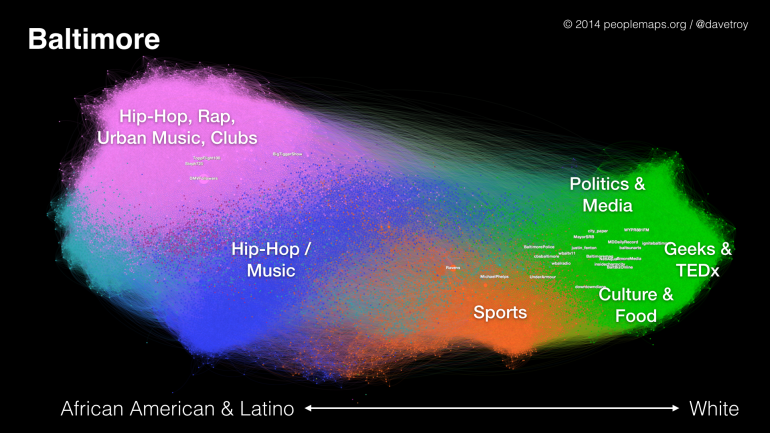
Dave Troy makes “people maps,” graphics that visualize cities and communities by people’s interests rather than their geography. Here he looks at the various divides in St. Louis, Missouri and asks if we might use this kind of analysis to predict the next Ferguson.

You get invited to a meeting by a person you don’t really know, about a project you’ve barely heard of, and you’re not sure why. ‘Click.’ You accept anyway. Find out just how much time this simple act wastes.