As designer Manuel Lima points out in his TED Talk, A visual history of human knowledge, the network has become a powerful way to visualize much of what is going on in the world around us. “Networks really embody notions of decentralization, of interconnectedness, of interdependence,” says Lima. “This way of thinking is critical for us to solve many of the complex problems we are facing nowadays, from decoding the human brain to understanding the vast universe out there.” Here, Lima shares a few of his favorite network graphics.
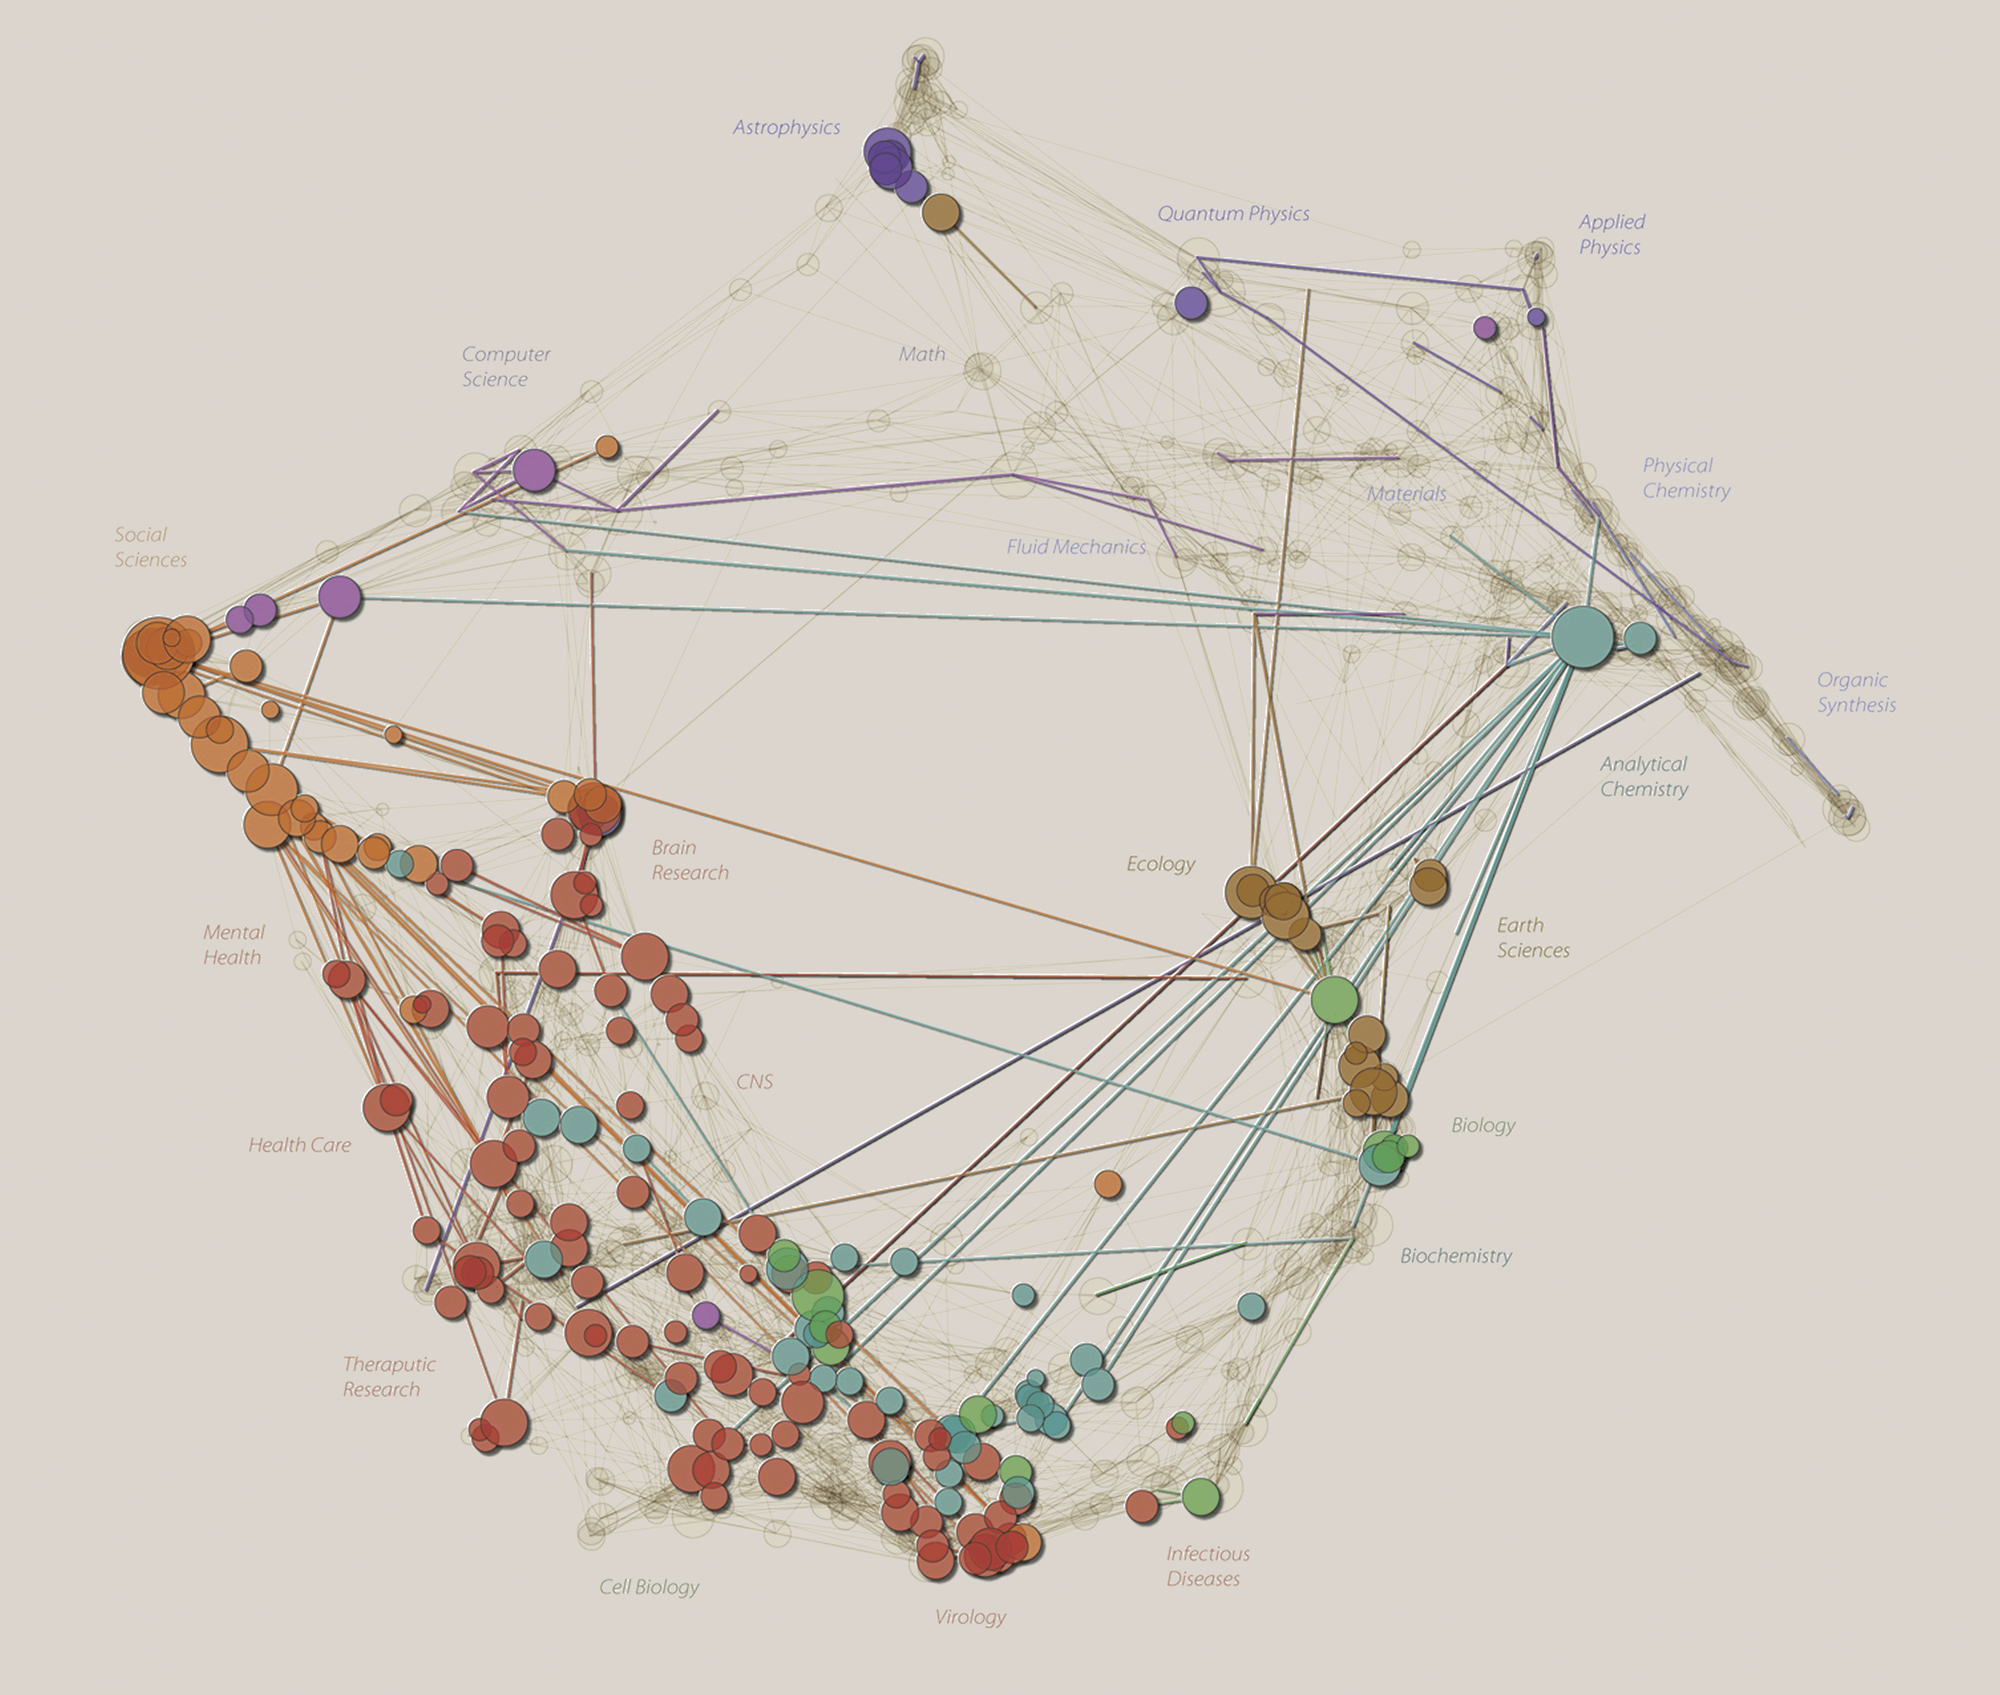
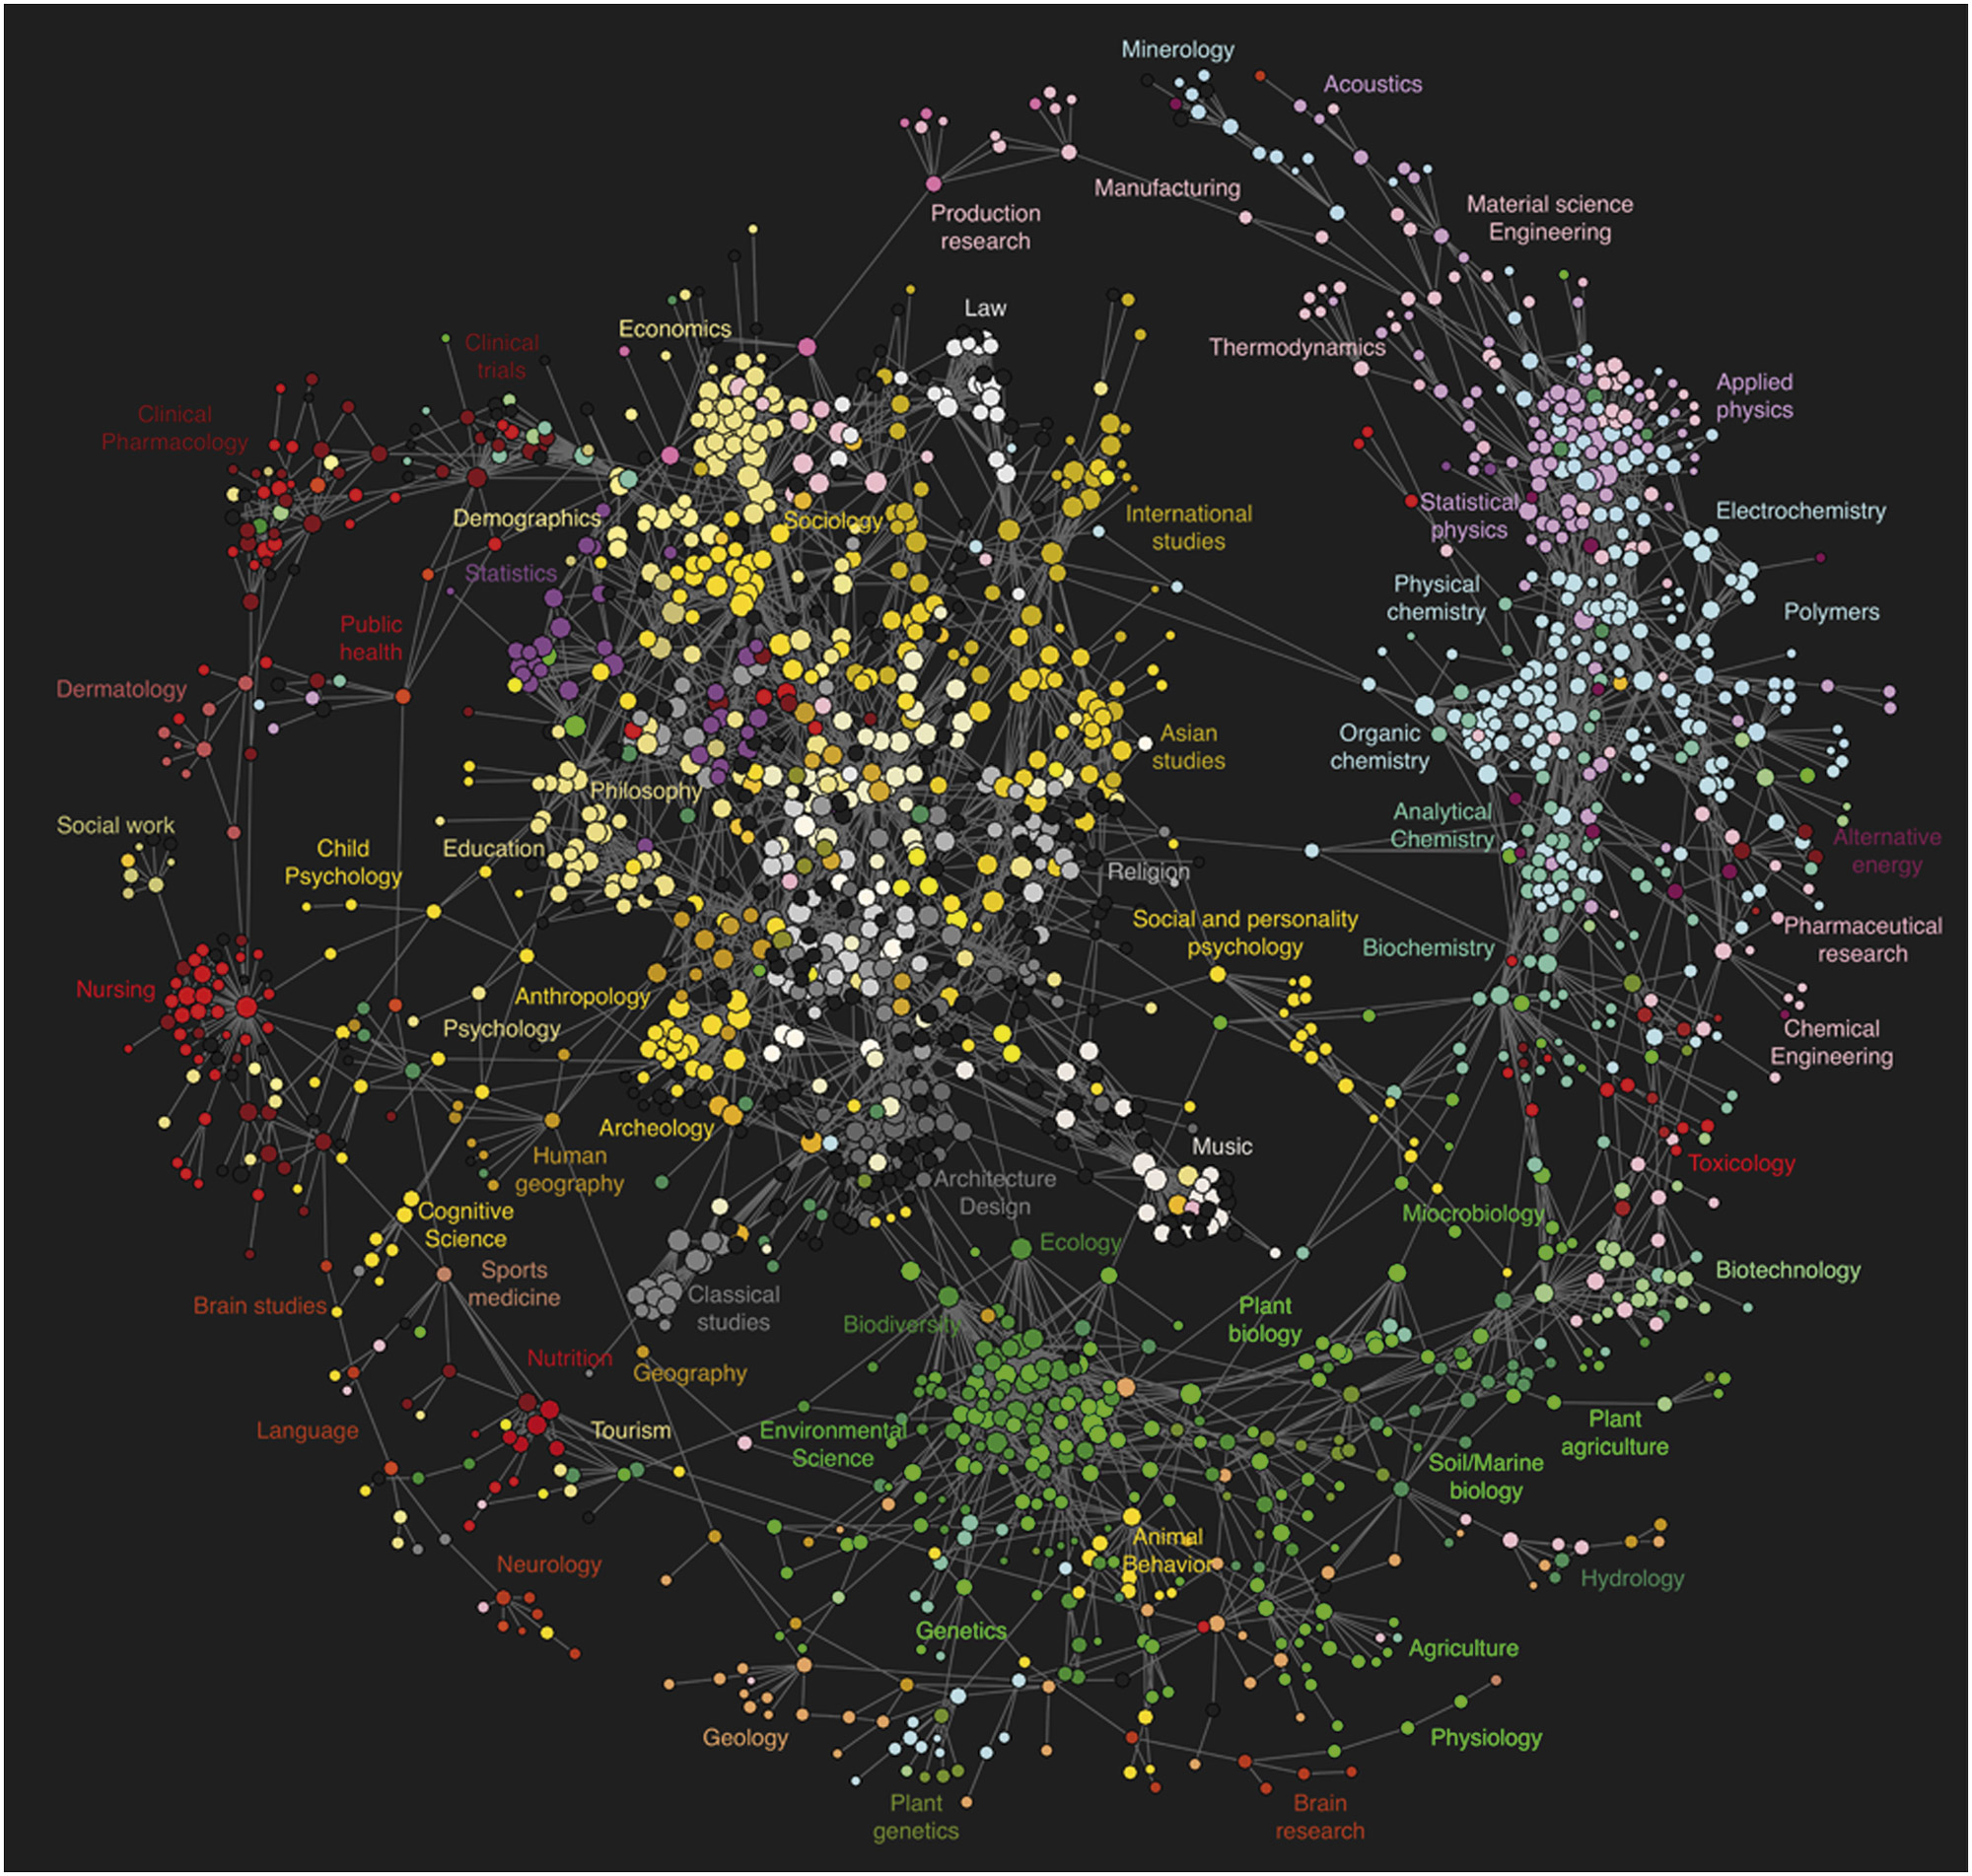
The Strengths of Nations
This image shows the connections between scientific disciplines such as astrophysics, math and biochemistry. Based on 800,000 references within 760,000 scientific articles, Lima says he is taken with the fact that the graphic shows so clearly the connections and adjacencies of certain scientific domains. Created by W. Bradford Paley, Dick Klavans and Kevin Boyack; image courtesy of W. Bradford Paley.
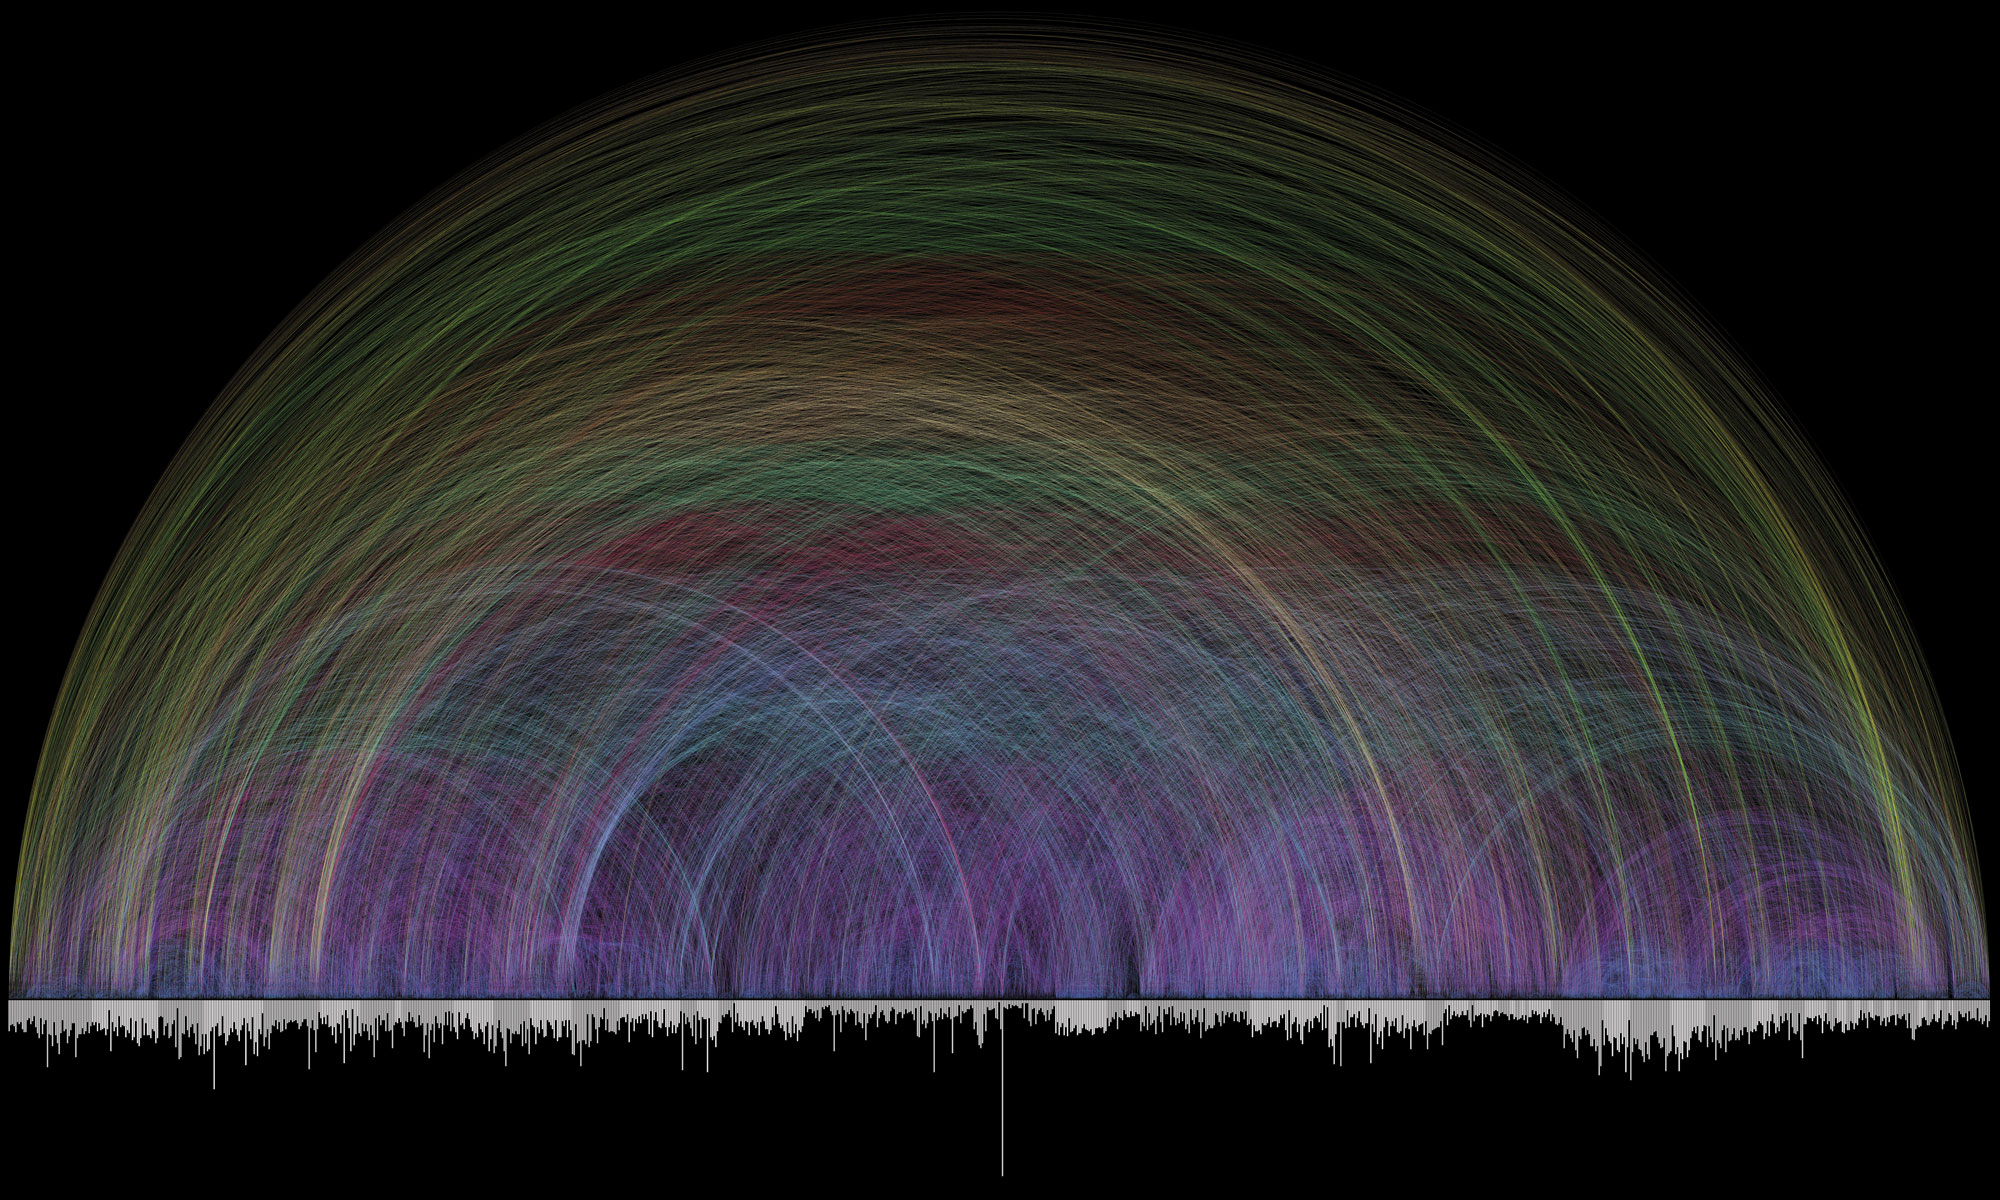
Visualizing the Bible
This 2007 map by Chris Harrison shows 63,779 cross-references found in the Bible. The bar graph on the bottom represents chapters (the longer the bar, the more verses in the chapter). Each cross-reference is depicted as a single arc with different colors used to reflect the distance between references. Image courtesy of Chris Harrison.
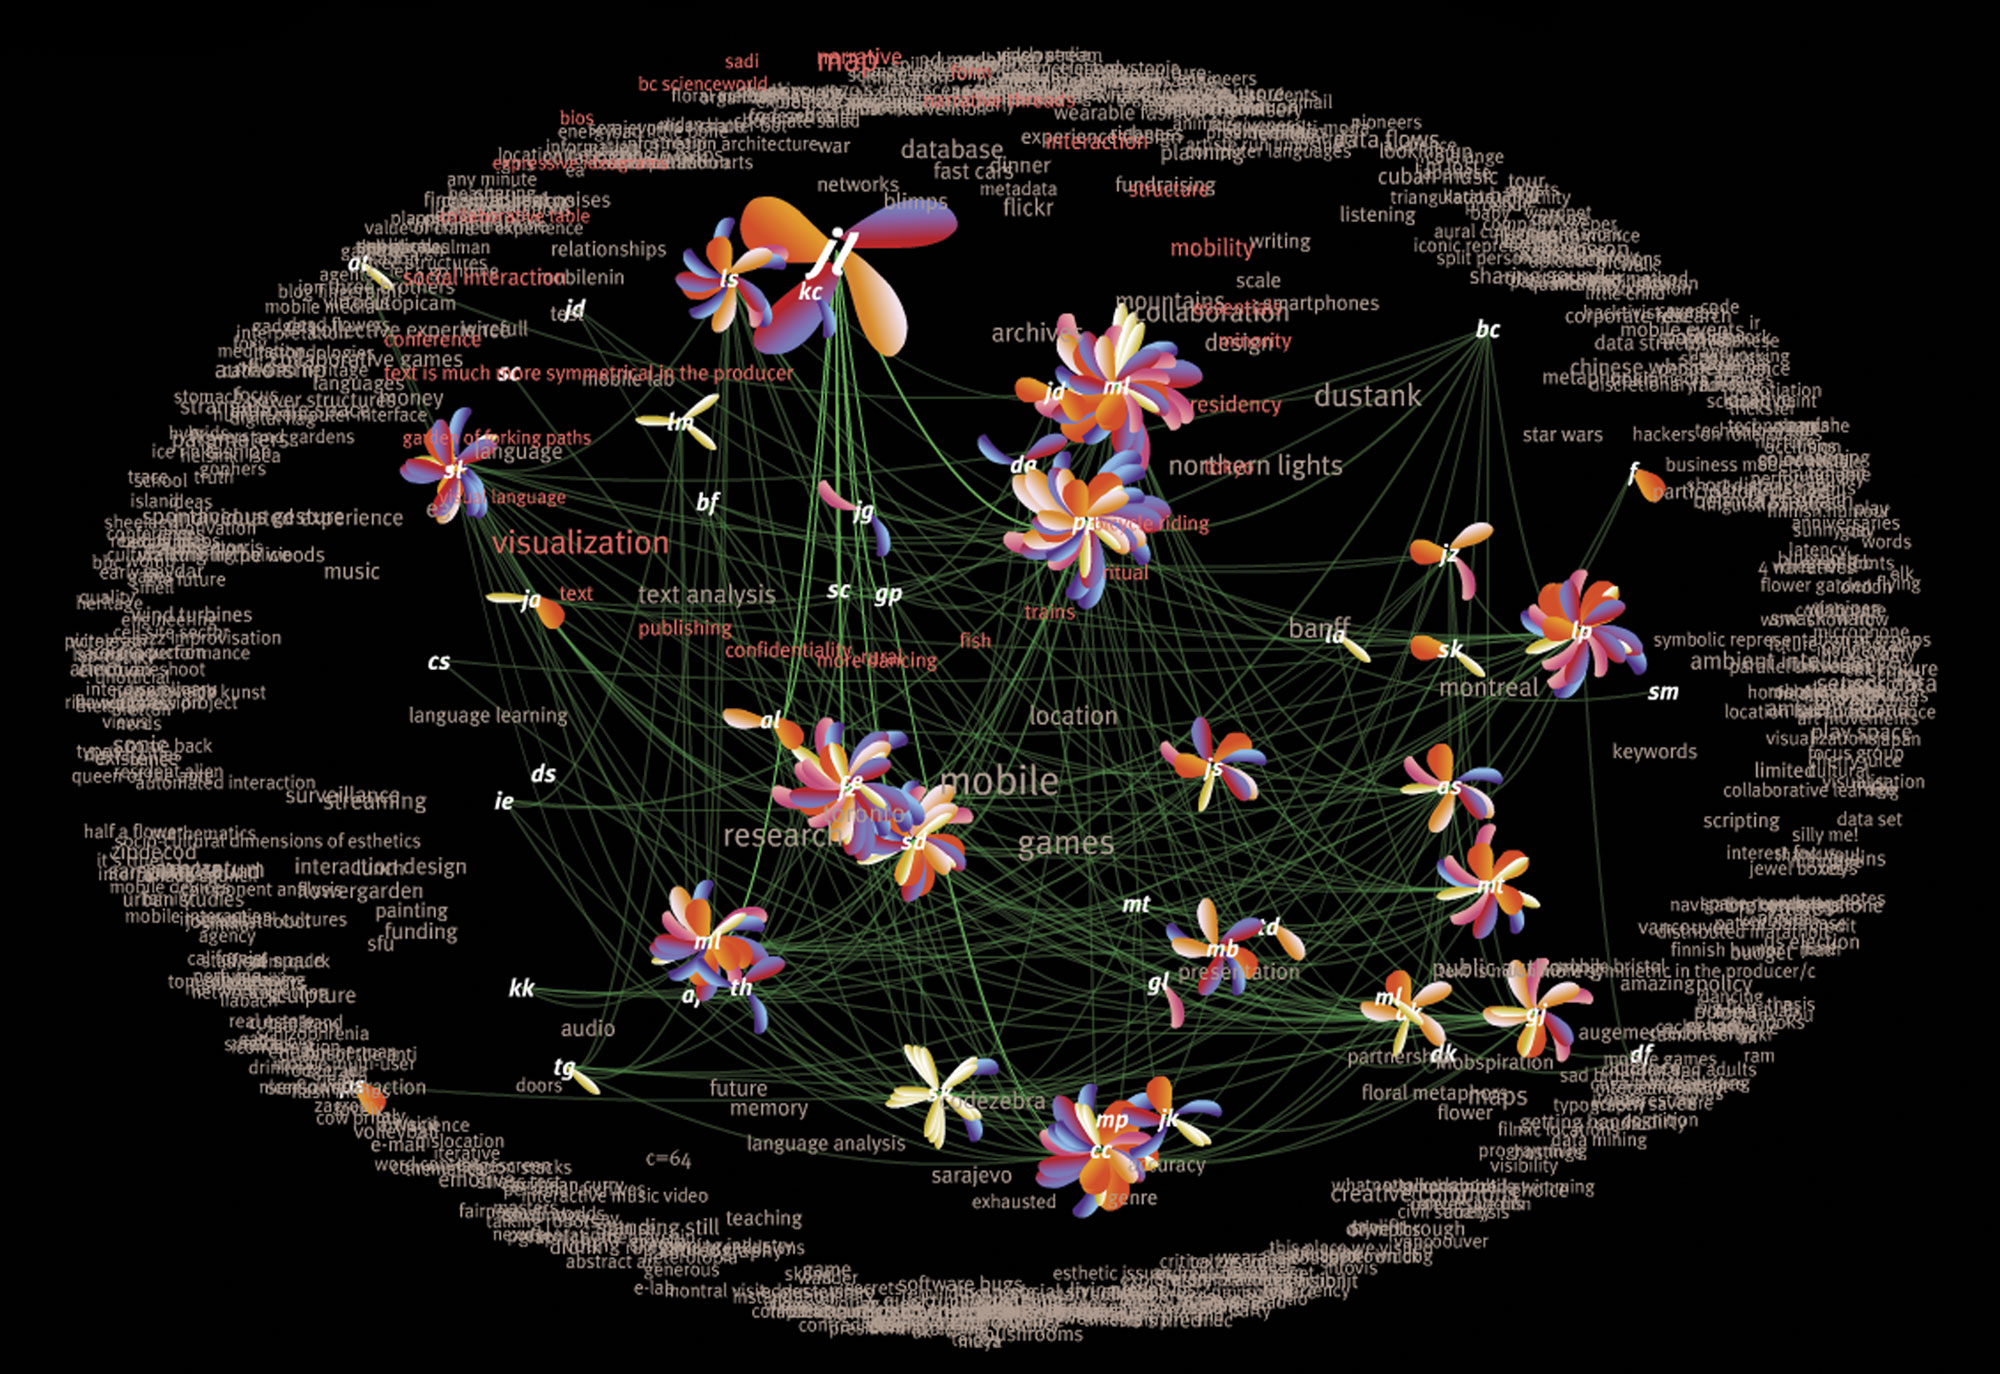
flowerGarden
This visualization by Greg Judelman and Maria Lantin shows the online discussion at a live event. “The flower is representative of individual participants, and it blossoms as new conversations are initiated while also creating green ties between those interacting,” says Lima. “Real-time chat is a hard topic to represent, and this is an interesting case for its use of an innovative visual metaphor.” Image courtesy of Greg Judelman.
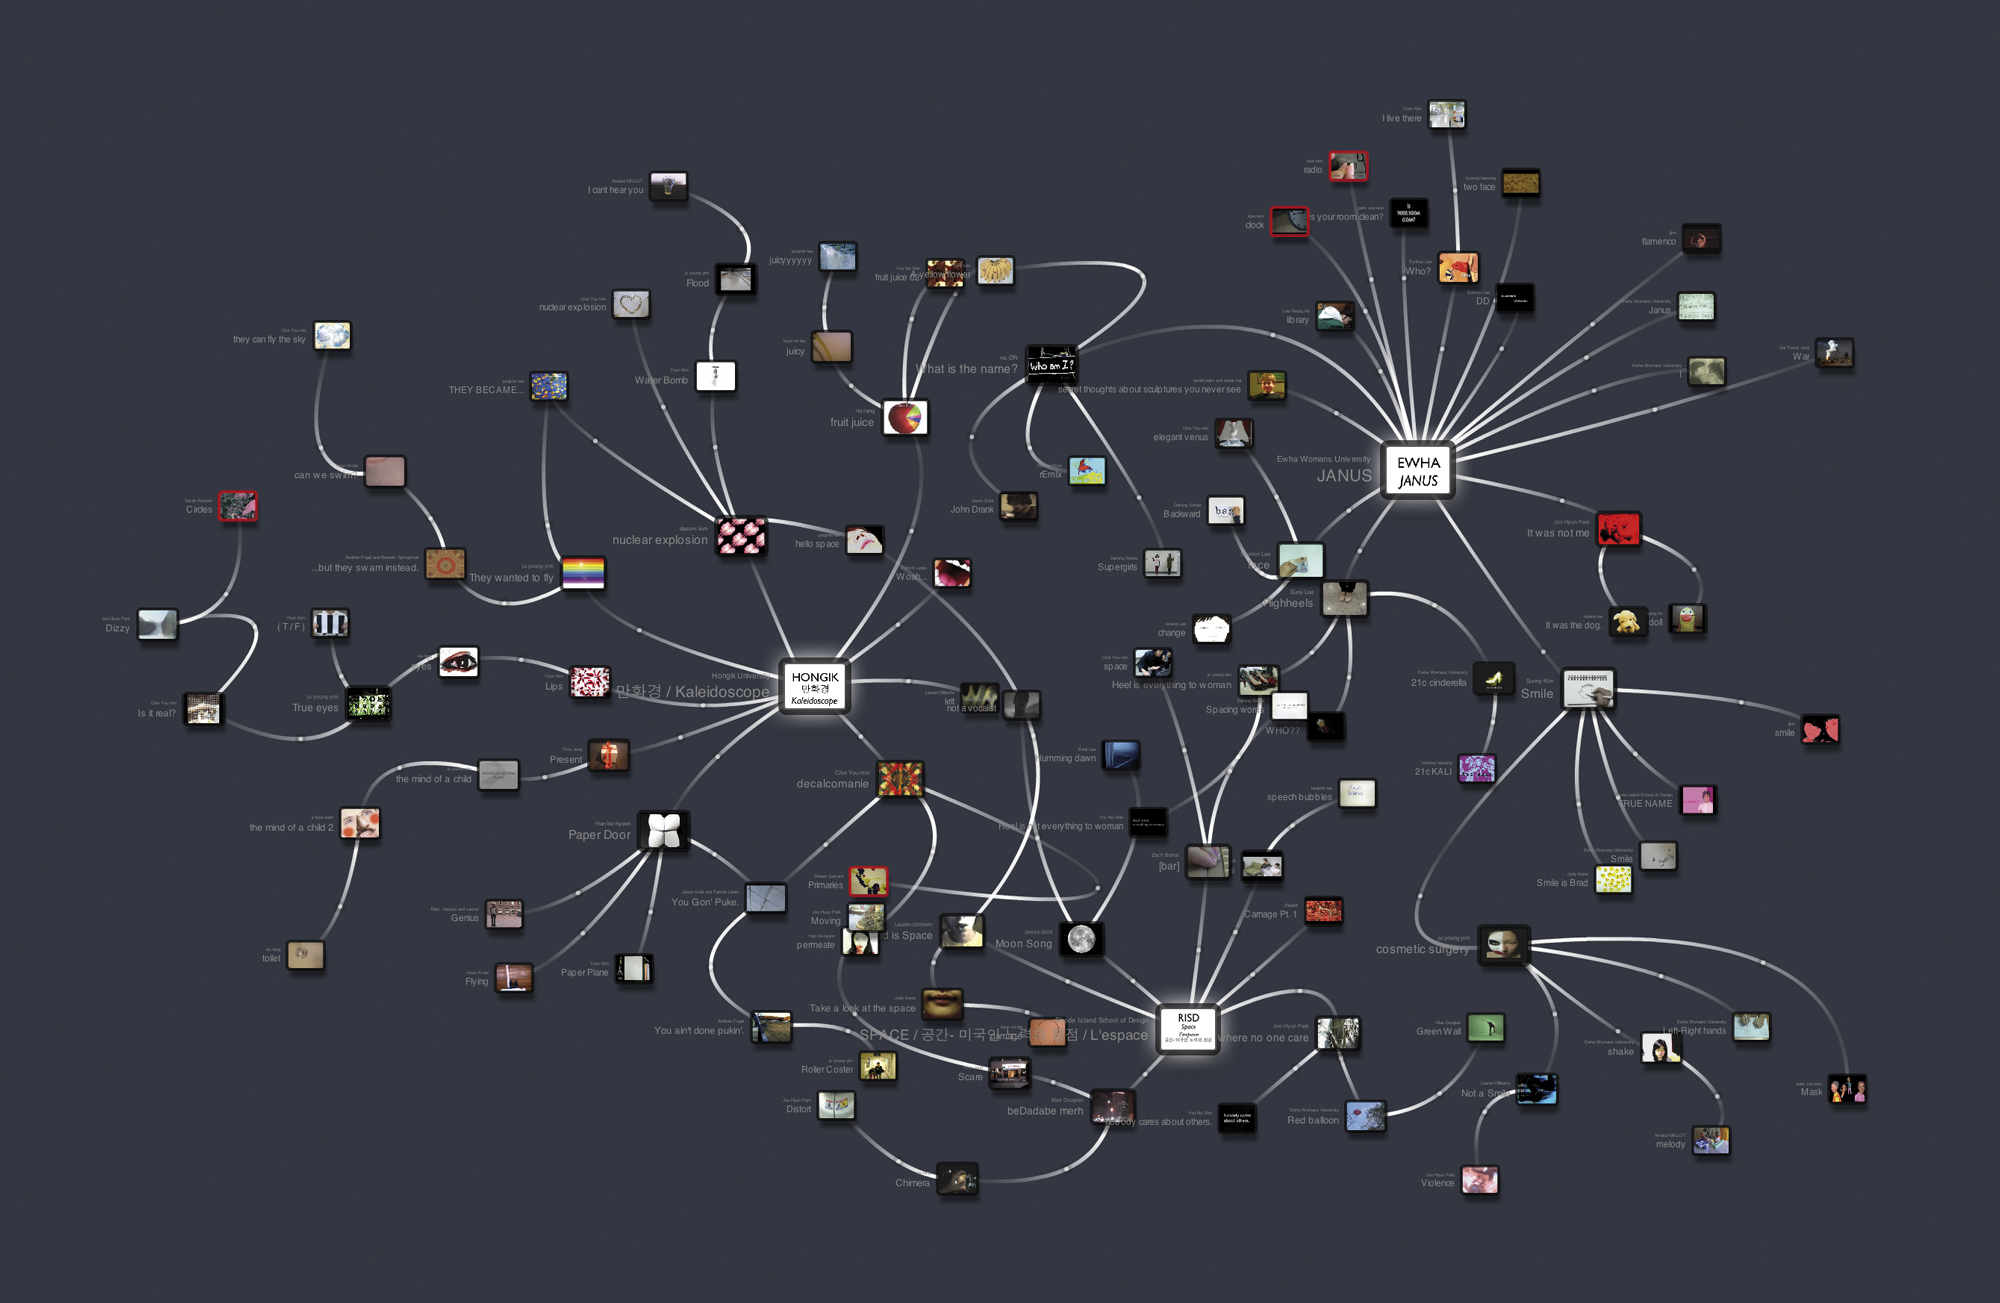
RISD.tv
This image by Daniel Peltz, Dennis Hlynsky and Chuan Khoo depicts a collaborative framework for video production at the Rhode Island School of Design in the United States. “Notice here that links aren’t straight lines,” says Lima. “They were trying to create an organic and fluid treatment, evocative perhaps of the invisible chain of inspiration between associated videos.” Image courtesy of Daniel Peltz.
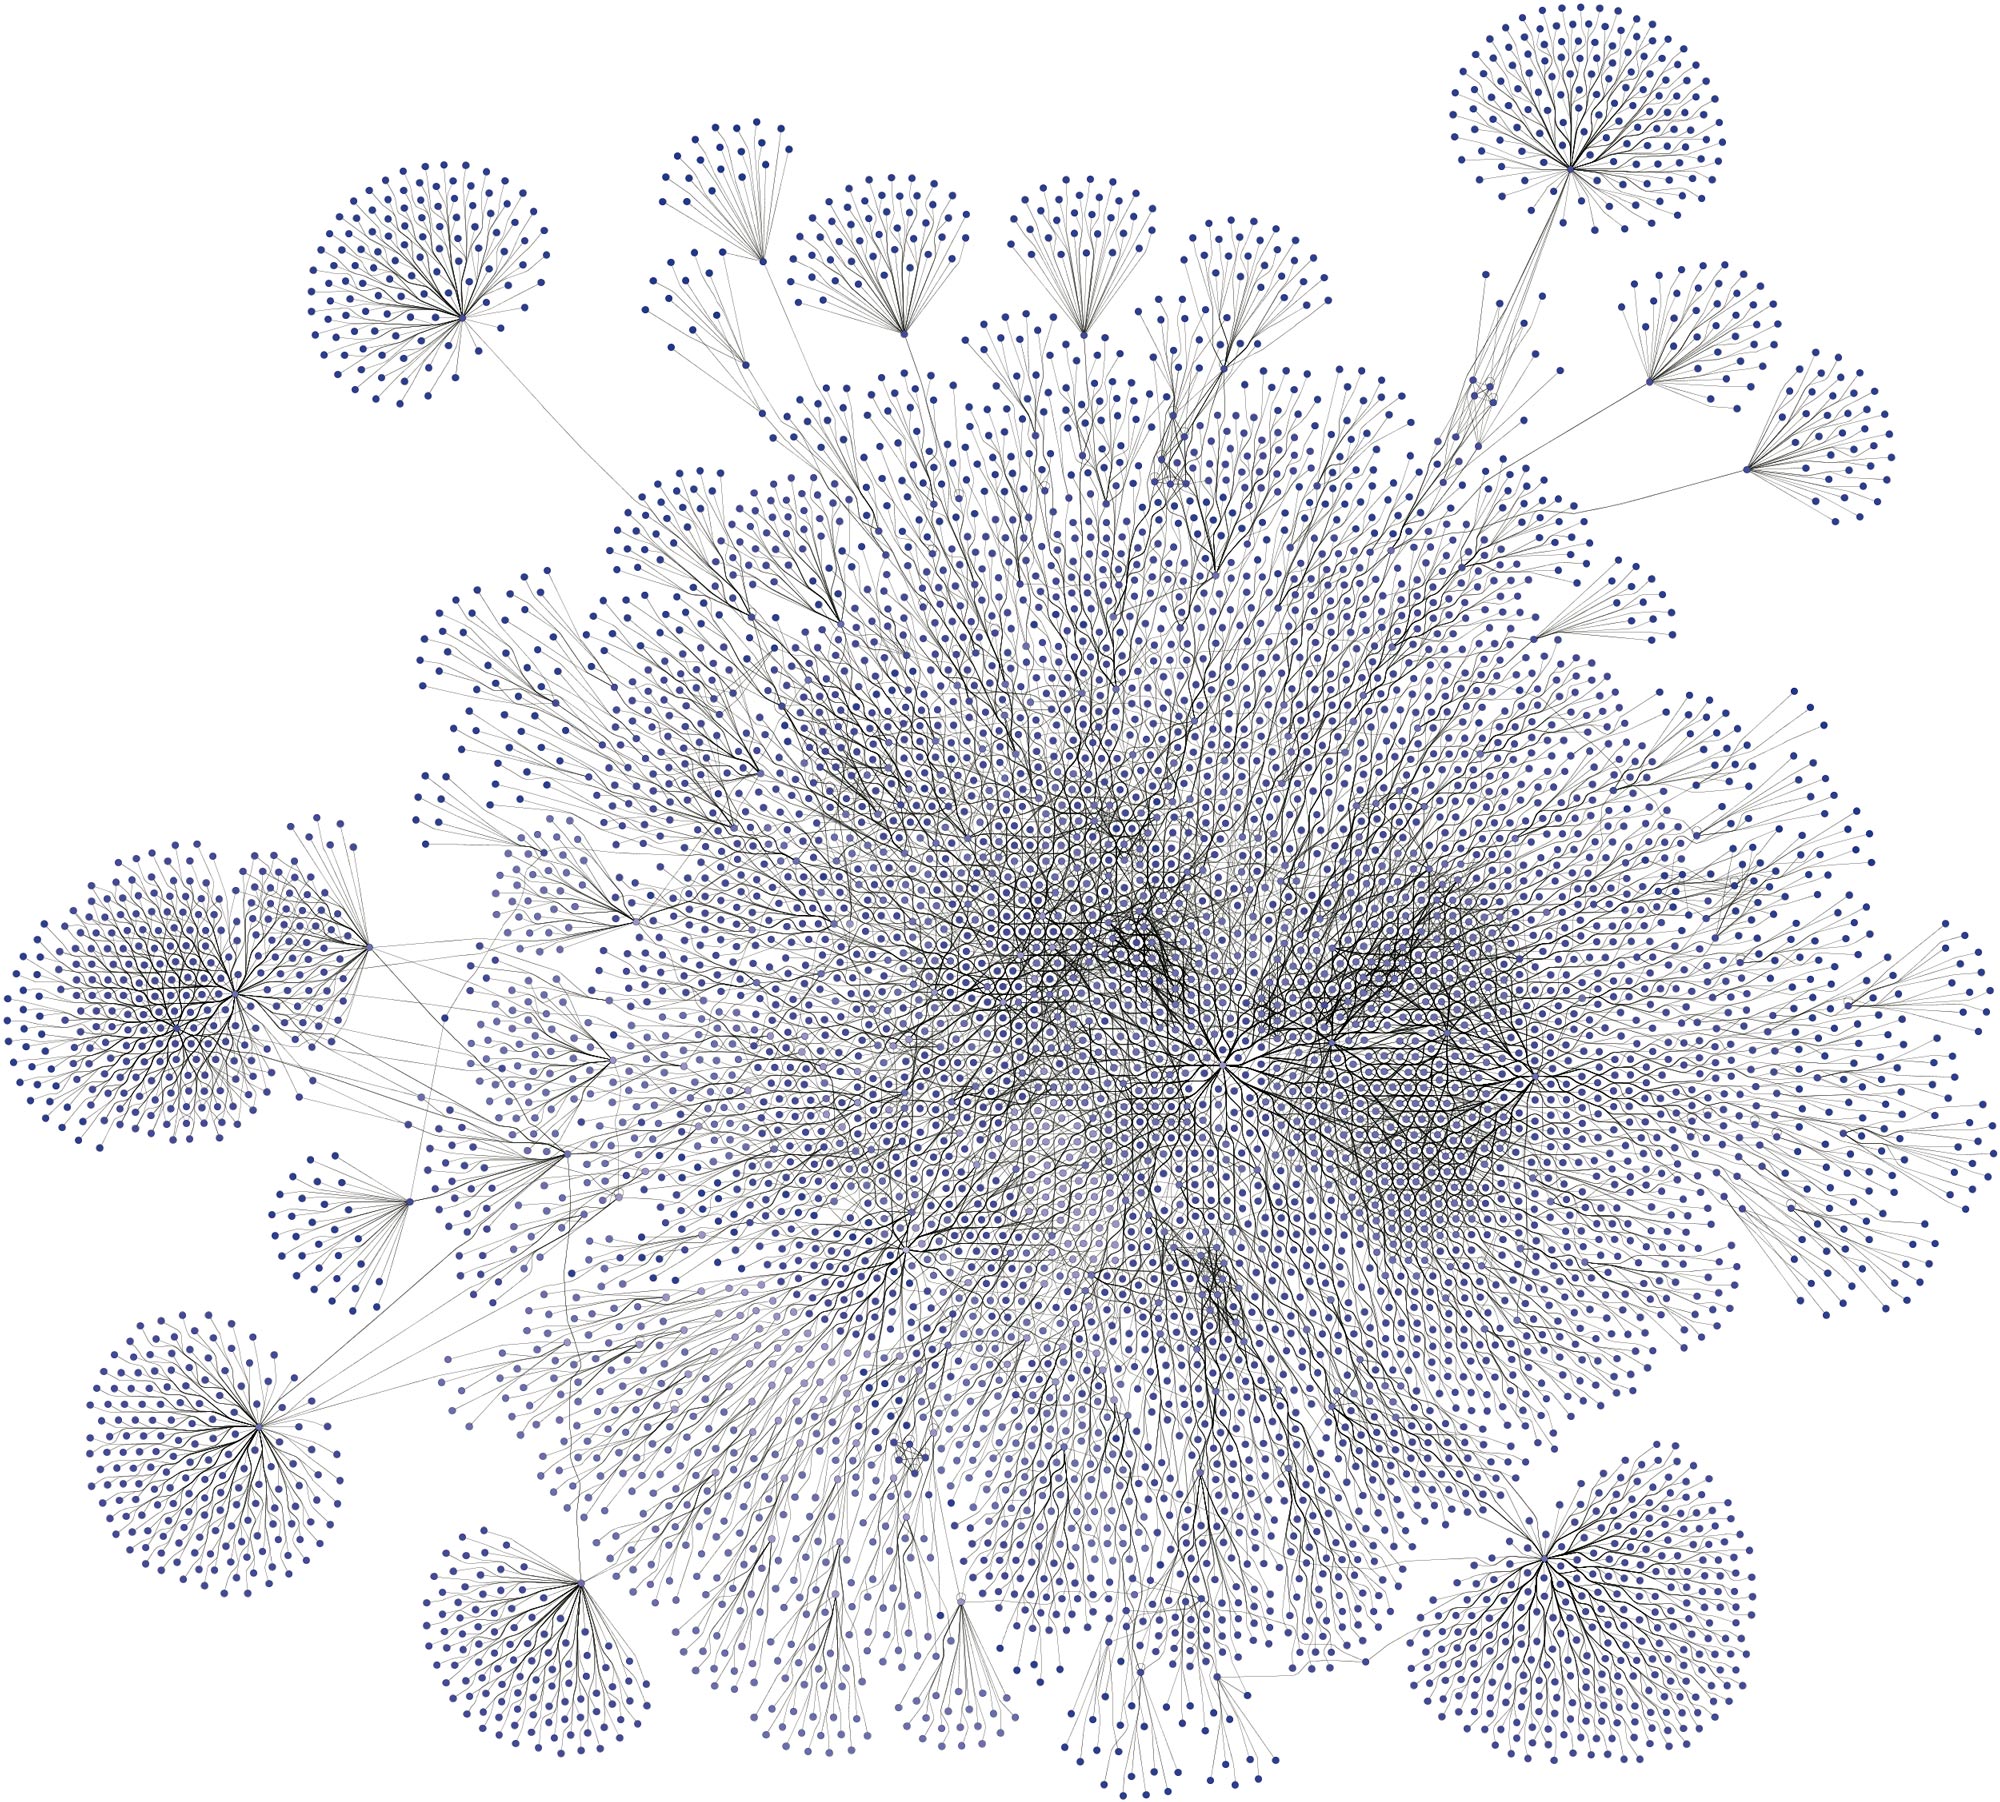
Map of Science
Another graphic showing the connections between scientific disciplines, this one was based on the way people read scientific papers online; its makers analyzed nearly a billion user interactions to make the map of connections. “In the 1300s there were trees of science; this one uses the network metaphor to create the intertwined links between domains,” says Lima. Image courtesy of J. Bollen, H. Van de Sompel, A. Hagberg, L. Bettencourt, R. Chute, et al.
yFiles
Although this looks like a piece of abstract art, there’s actually a lot going on here. “It’s a Java library of layout algorithms for graphs, charts and diagrams,” says Lima. “Over the last five years, coding libraries have emerged that allow you to include your data and visualize it. It’s really the ‘templatization’ of the field.” Image courtesy of Roland Wiese.
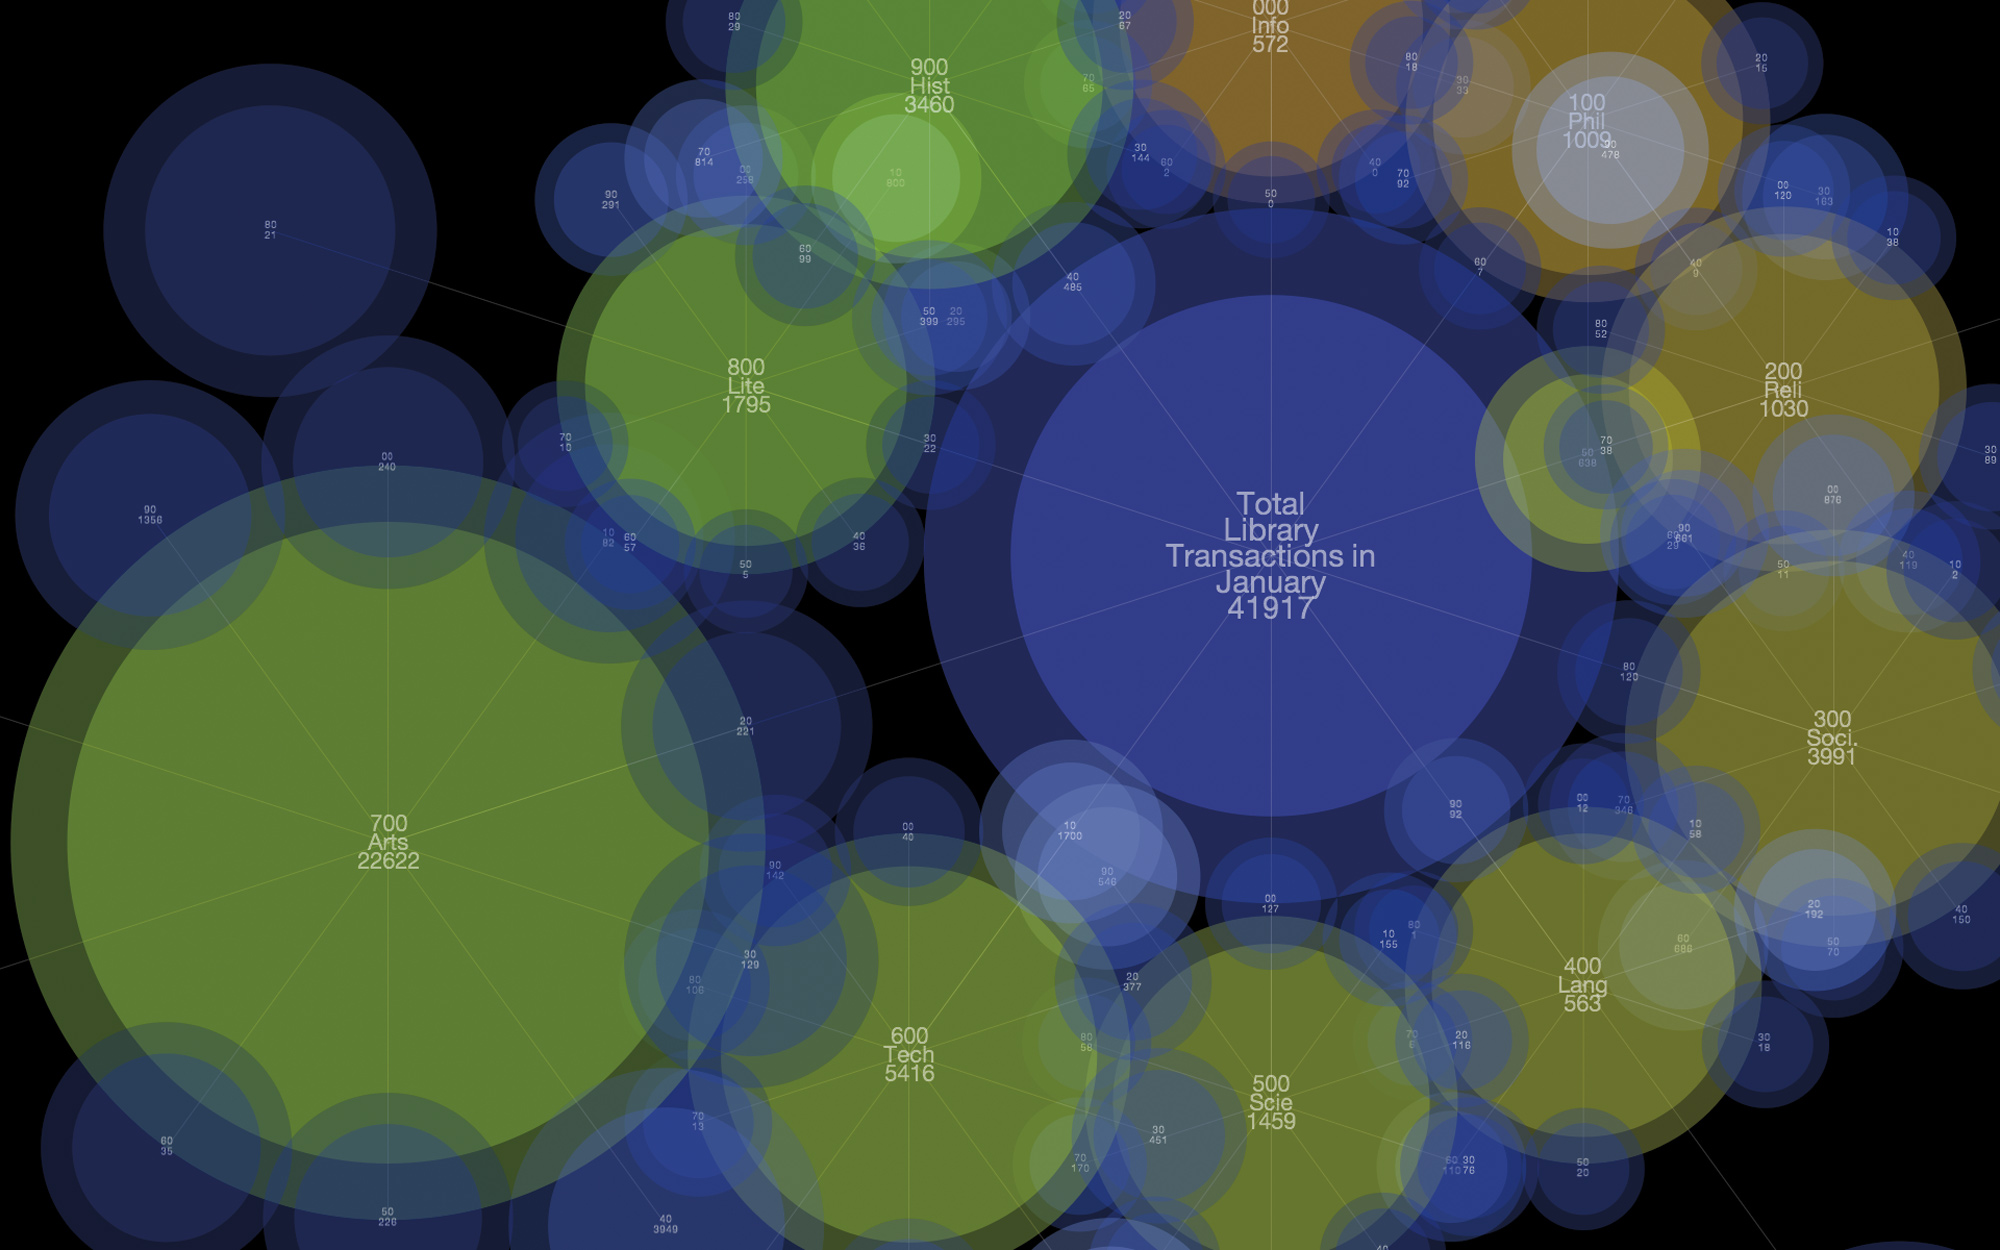
Dewey Circles
Here’s another representation of knowledge transfer, this time within the Seattle Public Library. The visual shows renting patterns, based on the Dewey Decimal classification system beloved by librarians everywhere. The bigger the circle, the more people borrowing books or media in that category. Image courtesy of Syed Reza Ali.
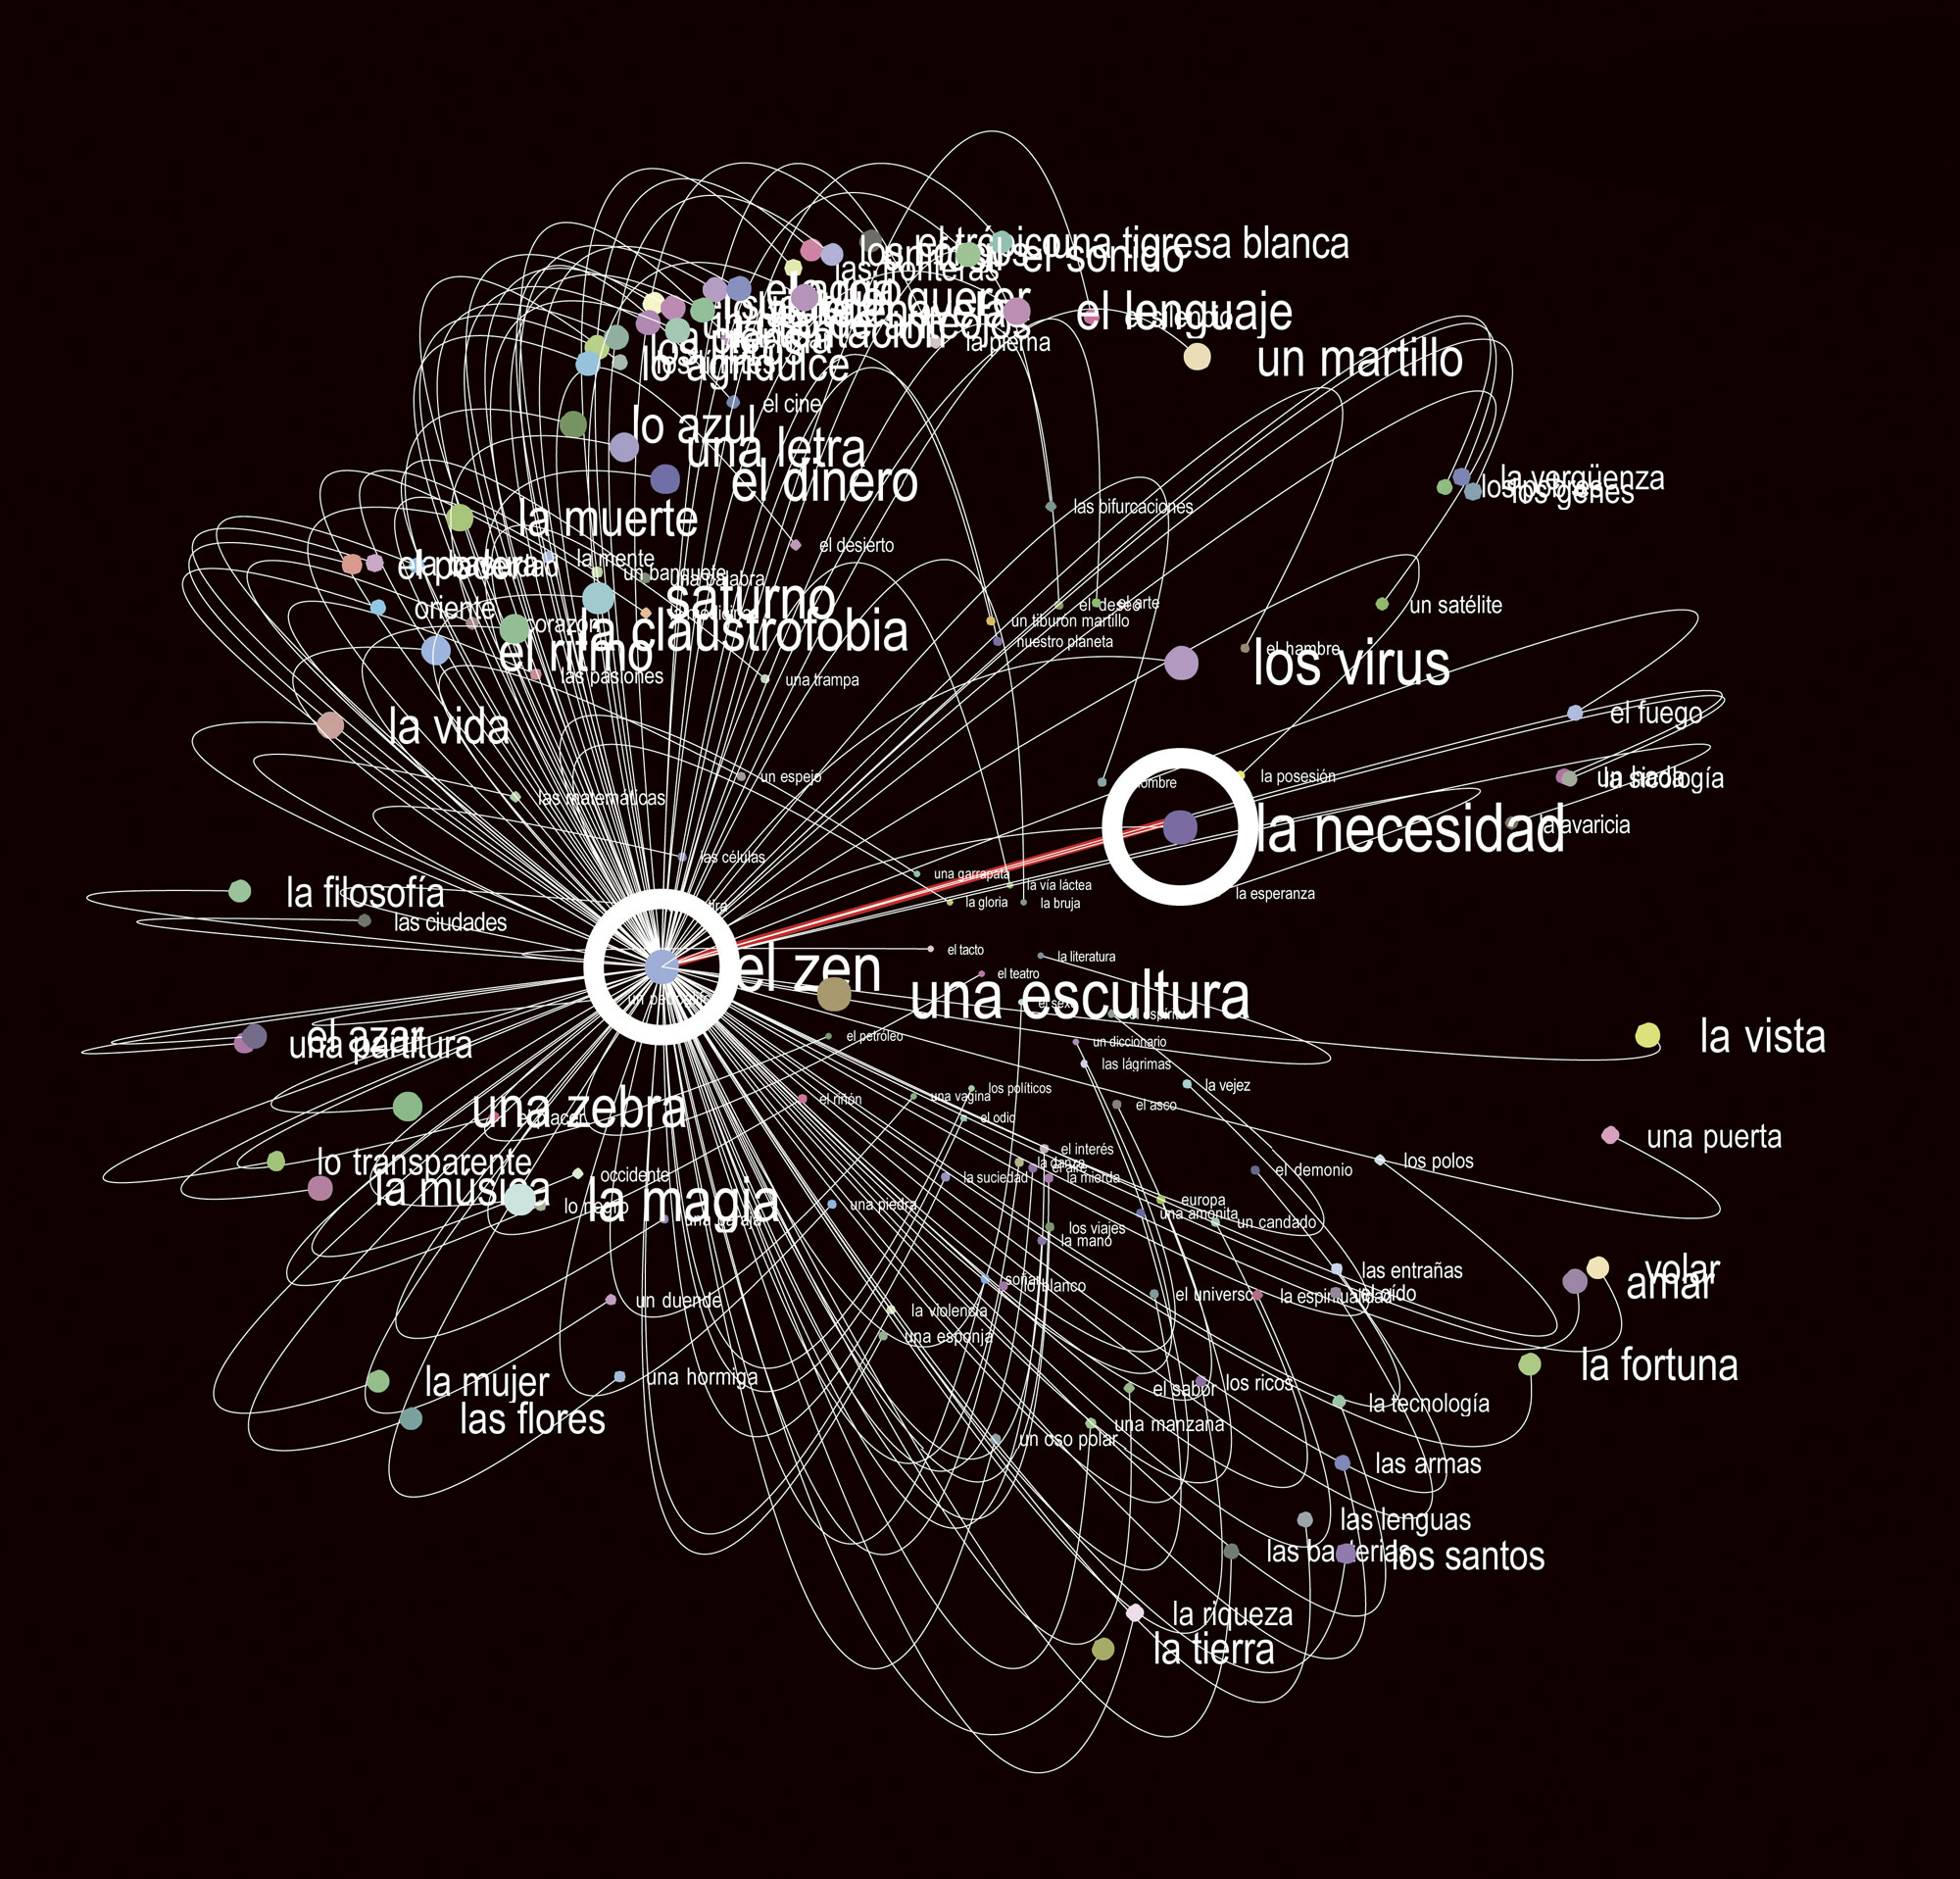
Spheres
This is a pretty typical type of network visualization, says Lima. “Content wise, it’s not unique; it’s showing the semantic links between Spanish words using a spherical visualization model. But I like it because it’s well executed.” Image courtesy of Santiago Ortiz.
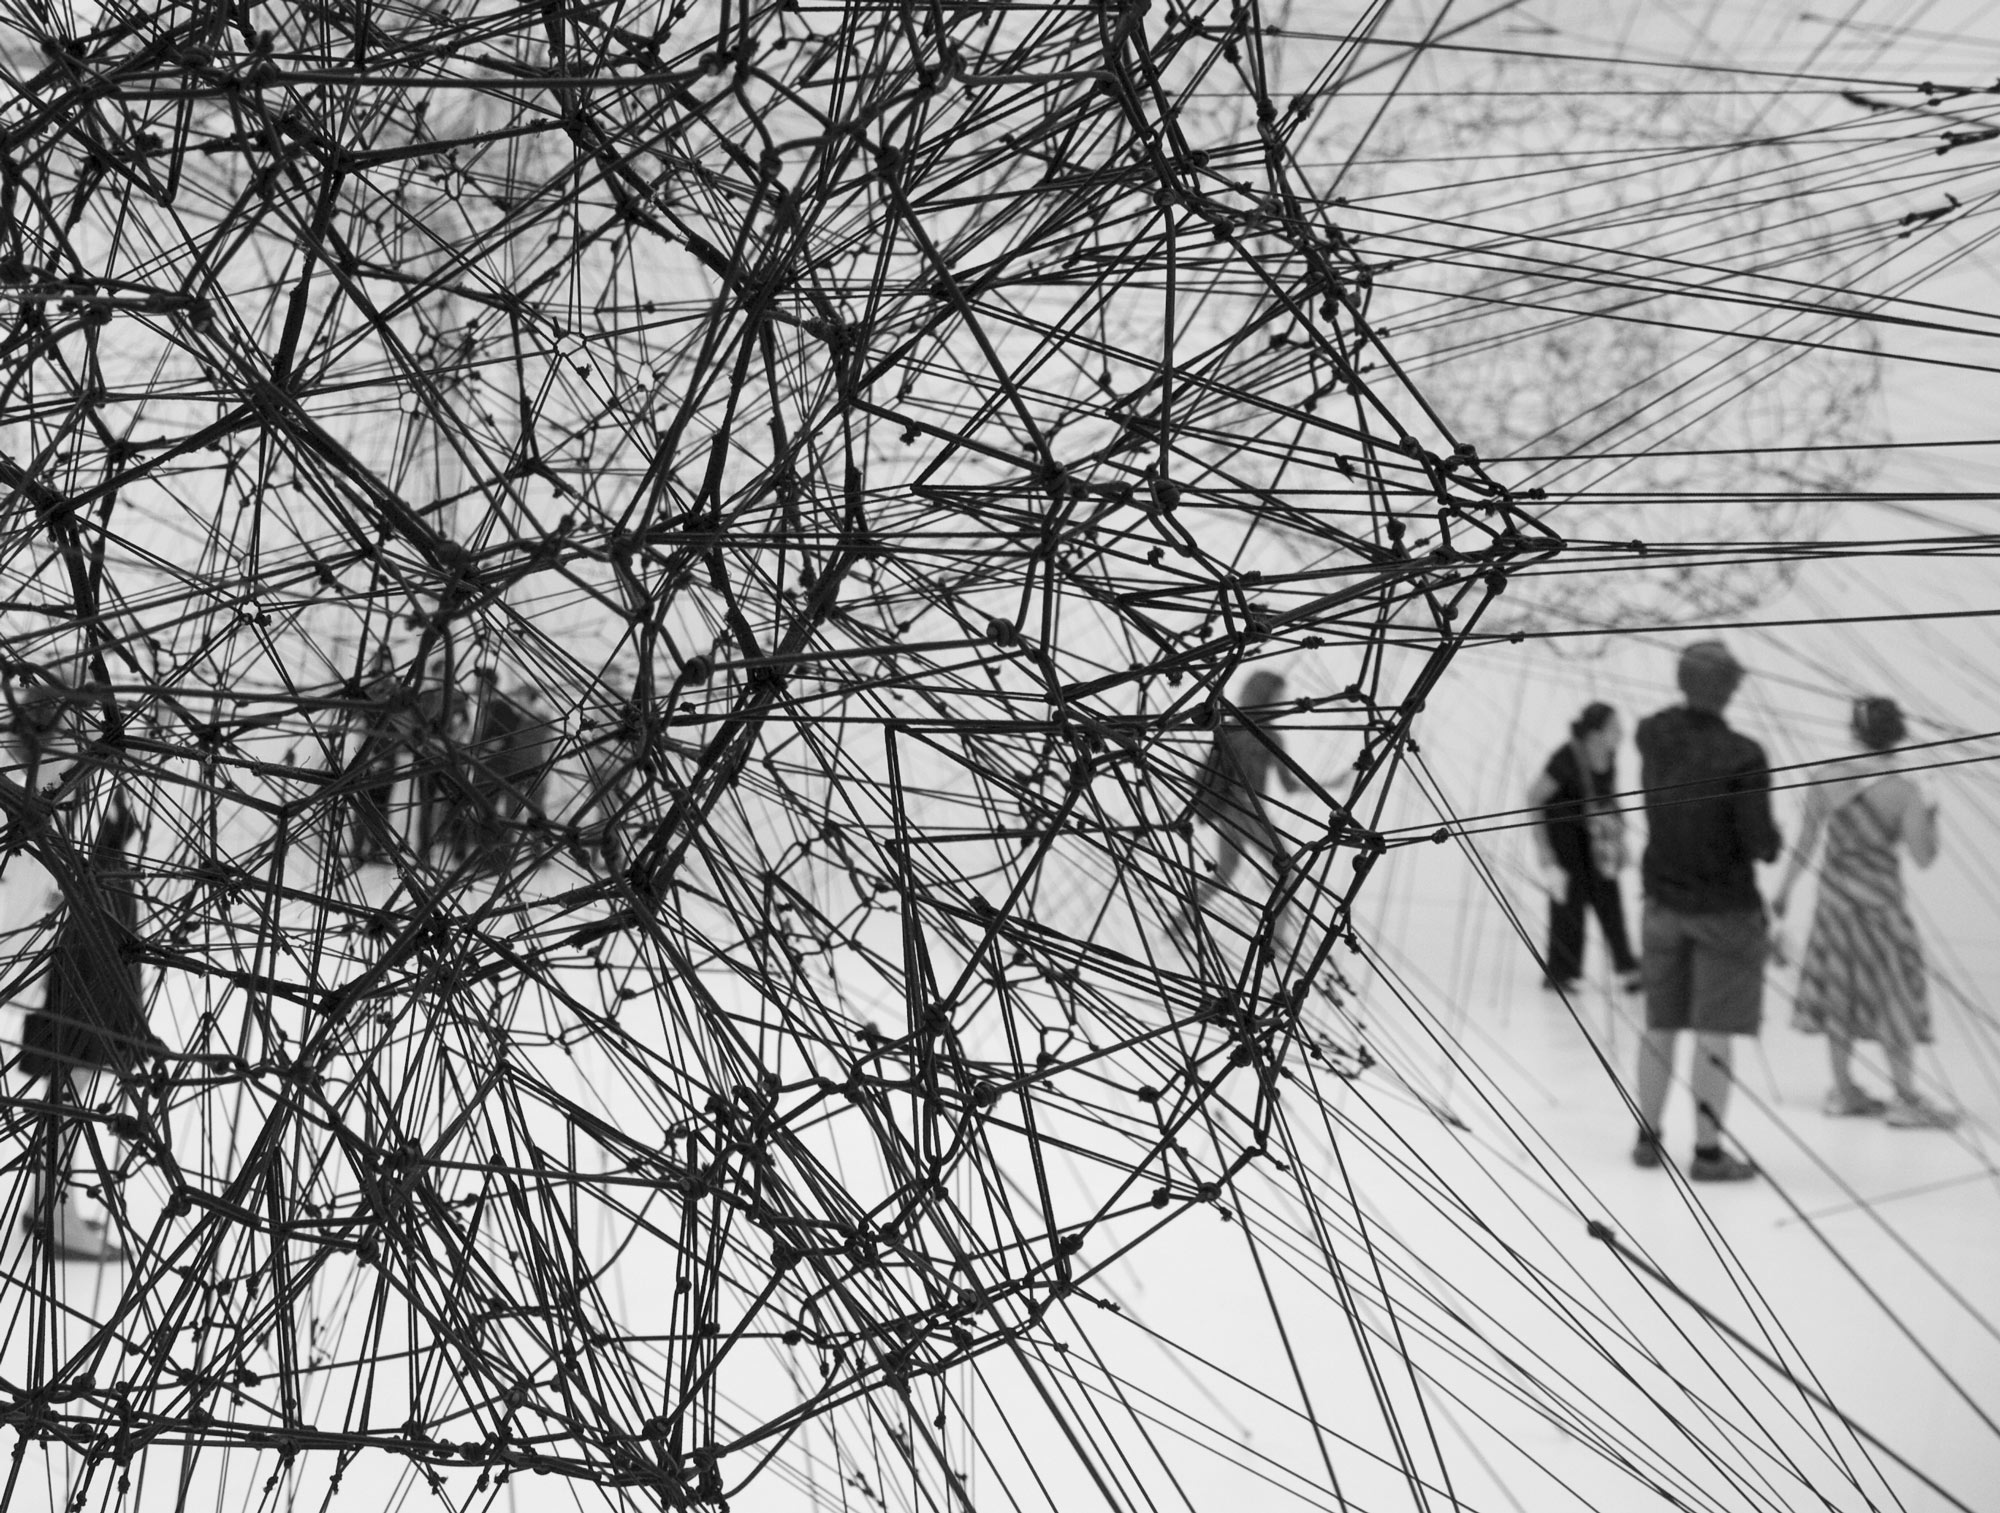
Galaxies Forming Along Filaments, Like Droplets Along the Strands of A Spider’s Web
“Many artists are obsessed with networks, and this one shows a large physical installation showing that the movement isn’t just happening in two dimensions,” says Lima. “It’s so beautiful; bounce on a rope and the whole network shifts.” Image courtesy of Tomas Saraceno.
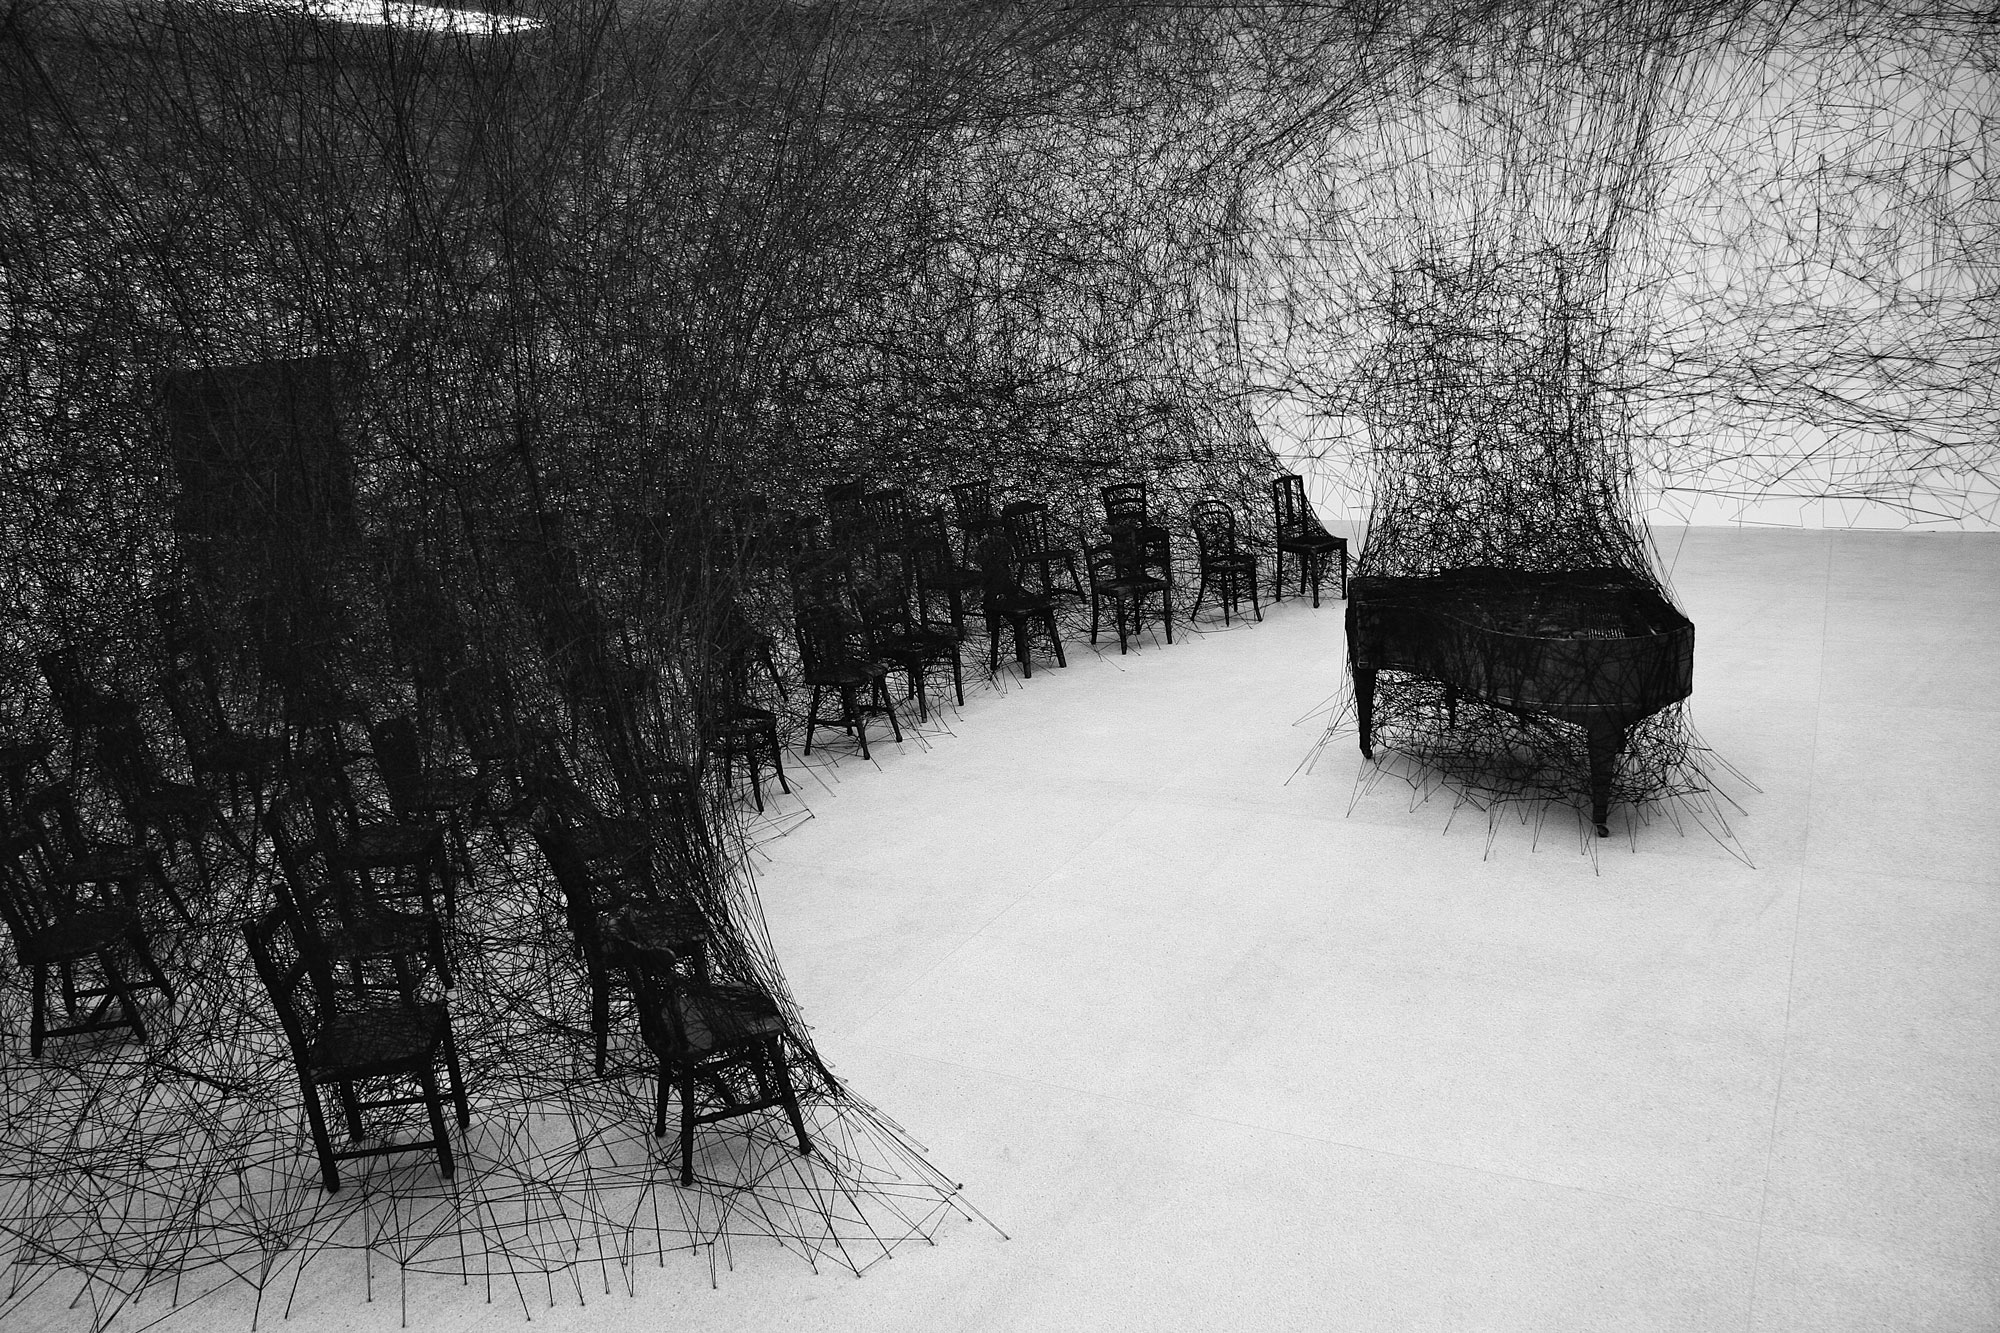
In Silence
“The artist Chiharu Shiota takes things to a whole different level,” says Lima. “She fills these massive spaces with black thread; sometimes she includes objects or people in an installation, and she creates dense, convoluted networks of black wool and thread. I love to see artists dealing with networks in their own way.” Image courtesy of Artists Rights Society (ARS), New York / VG Bild-Kunst, Bonn.