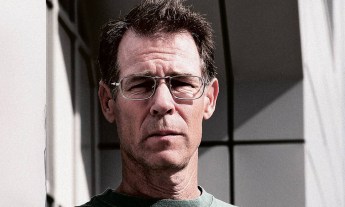
In the 1980s, space philosopher Frank White was a passenger in an airplane flying across the US. As he gazed at the miniature landscapes below, he started imagining what it would be like to live between Earth and the Moon. If you did, you wouldn’t see a planet divided by geopolitical borders, but rather a single, unified whole.
He interviewed astronauts, and his suspicions were confirmed when they described their shift in awareness after they saw Earth from space for the first time. They all described our planet as “fragile” and “beautiful” — and this experience altered how they viewed themselves within the universe. White coined this phenomenon the “overview effect.”
Now San Francisco-based authors, artist Benjamin Grant and writer Timothy Dougherty, want to inspire people everywhere to experience the overview effect — without leaving Earth — by showing us a perspective that we rarely see. Ultimately, they hope to raise awareness about the damage we’ve done to the environment so we can take steps towards creating a better future.
“Understanding how our choices impact the planet is an essential step if we hope to change course,” they write.
In their new book, titled Overview Timelapse: How We Change the Earth, they use satellite and aerial photos to show us how human activity is dramatically reshaping our world from a new vantage. “There is reason to be optimistic,” they write. “The same scientists who predicted and continue to monitor global climate change have made it clear that it is not too late to adopt solutions that can both support our species and move us toward a more harmonious relationship.”
Australian Bushfires, December 31 2019
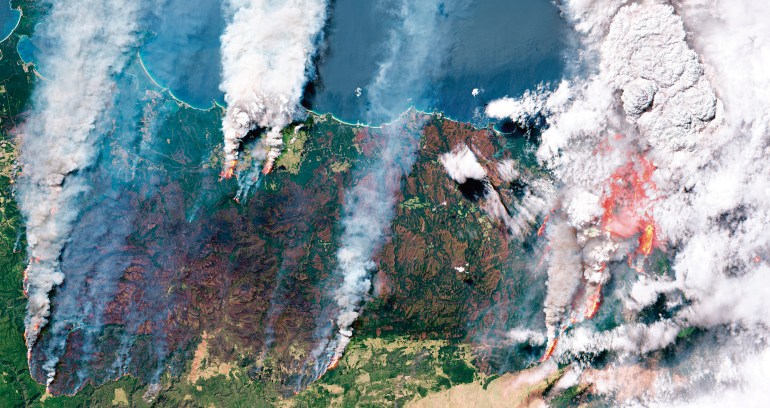
At the time of this photograph, this massive bushfire accounted for just a portion of the 38,000 square miles (or 98,420 square kilometers) that were torched by bushfires that started in September 2019 in New South Wales, Australia. This coastal area of the country contains eucalyptus trees, which release volatile oils when burned and thereby create massive embers that can quickly jump to other areas of the forest.
Climate conditions have not helped matters: 2019 was the warmest year in Australian history, and that — combined with the lowest rainfall since 1900 — created the dry conditions for the blaze to start and spread. After 240 straight days of fire, torrential rains arrived in February 2020 and ended the fire season.
Colorado Tire Graveyard, March 2018 and August 2018
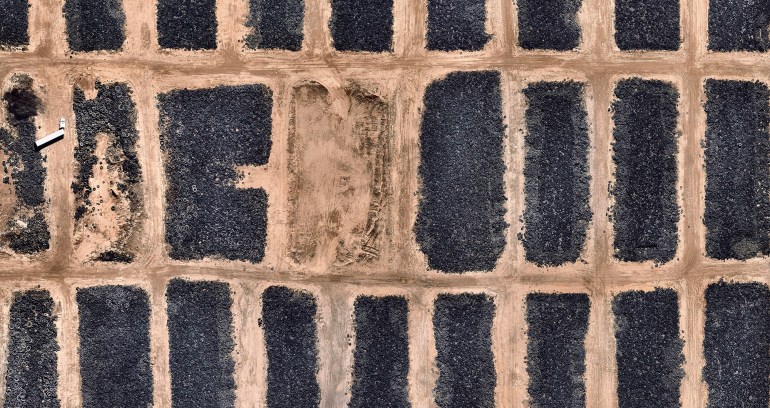
Tires are added to massive piles at the world’s largest tire dump located in Hudson, Colorado. The facility contains dozens of roughly 150-foot-wide (or 45 meters) sections filled with approximately 60 million scrap tires. Worldwide, an estimated 1.5 billion tires are discarded each year. Of that amount, more than half are burned for their fuel.
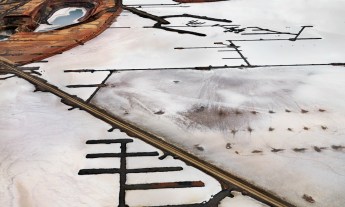
Antarctic Sea Ice Melt, 2019
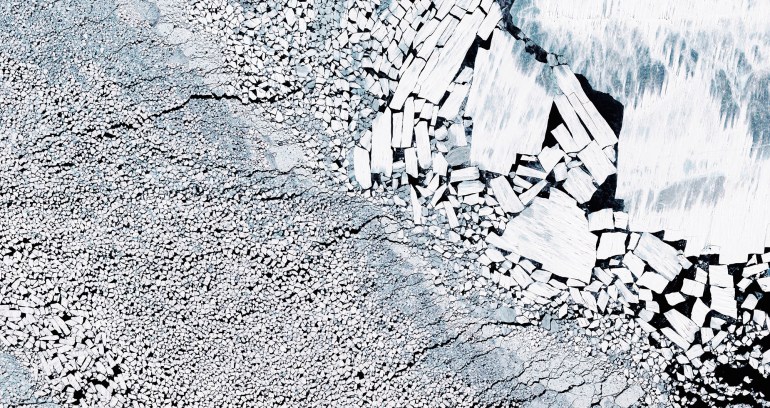
Sea ice breaks apart in various block sizes roughly 40 miles (or 64 kilometers) off the coast of Antarctica. Antarctic sea ice extends far north in the winter and retreats almost to the coastline every summer. The ice is frozen seawater that is usually less than 3 to 6 feet (or 0.9 to 1.8 meters) in thickness. Sea ice is significantly thinner than ice shelves, which are formed by glaciers, float in the sea and are up to 3,280 feet (or 1 kilometer) thick.
In the 1980s, Antarctica lost 40 billion tons (or 36.3 billion metric tons) of ice every year; in the last decade, that figure was estimated at a staggering 252 billion tons (229 billion metric tons) per year. When ice melts, it often exposes a darker area of soot and dirt beneath its surface and turns into darker liquid water once it is fully melted. Dark surfaces absorb more heat, and thus the accelerated melting of the world’s ice could initiate a feedback loop that further speeds up the warming process that’s causing the melting in the first place.
Miami Red Tide, May 2017 and June 2018
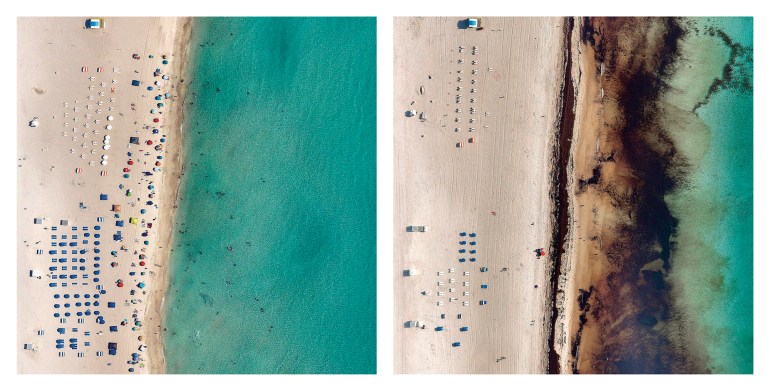
In 2018, tides of harmful algae blooms overtook the waters surrounding Miami, Florida, forcing the closure of at least six public beaches. The increased growth of dark algae discolors the typically clear waters, hence the “red tide” name. While it is difficult to pinpoint the exact cause of this phenomenon, red tides tend to follow intense storm seasons, and they may also be fueled by agricultural runoff bringing large amounts of unnatural fertilizers into the ocean.
This specific algae, Karenia brevis, produces toxic chemicals that can affect fish and beachgoers alike due to its neurotoxicity and irritative respiratory properties. Red tides can last anywhere from a few weeks to more than a year depending on ocean temperatures, sunlight, salinity, winds and currents.
Westmont Rooftop Solar Project, 2014 and 2017
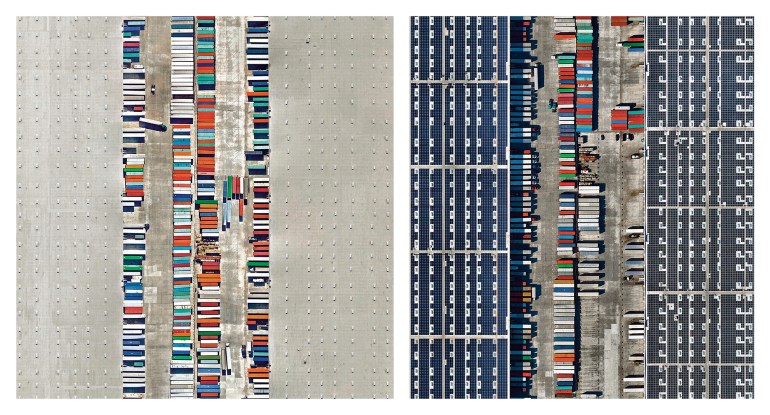
The Westmont Distribution Center, with its rooftop solar project, is located in San Pedro, California. At the time of its installation in 2017, Westmont was the most powerful rooftop solar project in the US, with the exception of Apple’s new headquarters.
The 2 million square feet (or 185,806 square meters) of panels have a bifacial design, meaning they can collect reflected light from the surface of the roof in addition to direct sunlight. This enables the panels to generate up to 45 percent more power than traditional rooftop solar panels and power 5,000 nearby homes.
Amazon Rainforest Deforestation, 1989 and 2019
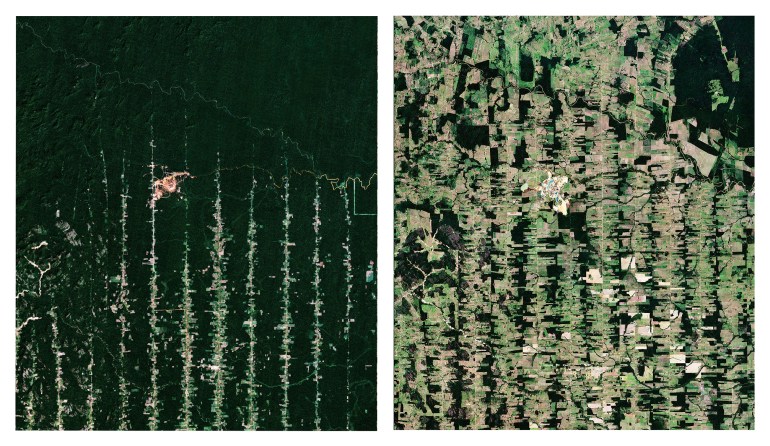
The state of Rondônia in western Brazil has become one of the most deforested parts of the Amazon rainforest. Once home to 80,000 square miles (or 207,199 square kilometers) of forest, the past three decades have seen rapid clearing and degradation. By 2003, an estimated 26,000 square miles (or 67,340 square kilometers) of rainforest — an area that’s larger than the state of West Virginia — had been cleared.
That devastation continued in the following decades and was greatly exacerbated by the Amazon fires of 2019. At one point during the year, 76,000 fires were burning simultaneously, with many ignited for purposeful deforestation, destroying roughly 7,200 square miles (18,648 square kilometers) of forest.
Russia Permafrost Melt, 2018
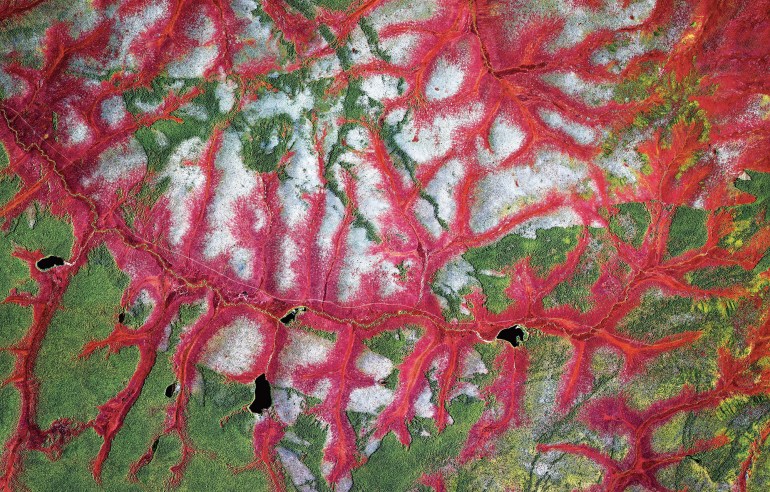
Vibrantly colored lichens and mosses can be seen here alongside frost-covered ground in Yakutia, Russia. The Yakutia region is one of the coldest inhabited places on Earth with an average January temperature of -41.3°F (or -40.7°C). However, annual temperatures here have risen more than four degrees, to 18.5°F (or -7.5°C) from 14°F (or -10°C), over several decades.
This warming has led to increased melting of the region’s permafrost — a thick subsurface layer of soil that remains frozen throughout the year. As permafrost thaws across Yakutia and other arctic areas, stored methane is released into the atmosphere, which warms the planet 84 times more than carbon dioxide over a 20-year period.
In 2013 alone, melting of permafrost is believed to have released 18.7 million tons (17 million metric tons) of methane — a significant increase on the 4.2 million tons (3.8 million metric tons) estimated to be released in 2006.
Reprinted with permission from the book Overview Timelapse: How We Change the Earth by Benjamin Grant and Timothy Dougherty. Copyright ©2020. Published by Ten Speed Press, an imprint of Penguin Random House.
To see a new satellite image every day, check out the Daily Overview Instagram account. Watch Benjamin Grant’s TED Talk here: